BT Trading Hub › Learn › How to use Cycle Lows
How to use Cycle Lows: daily, weekly and yearly cycle lows explained
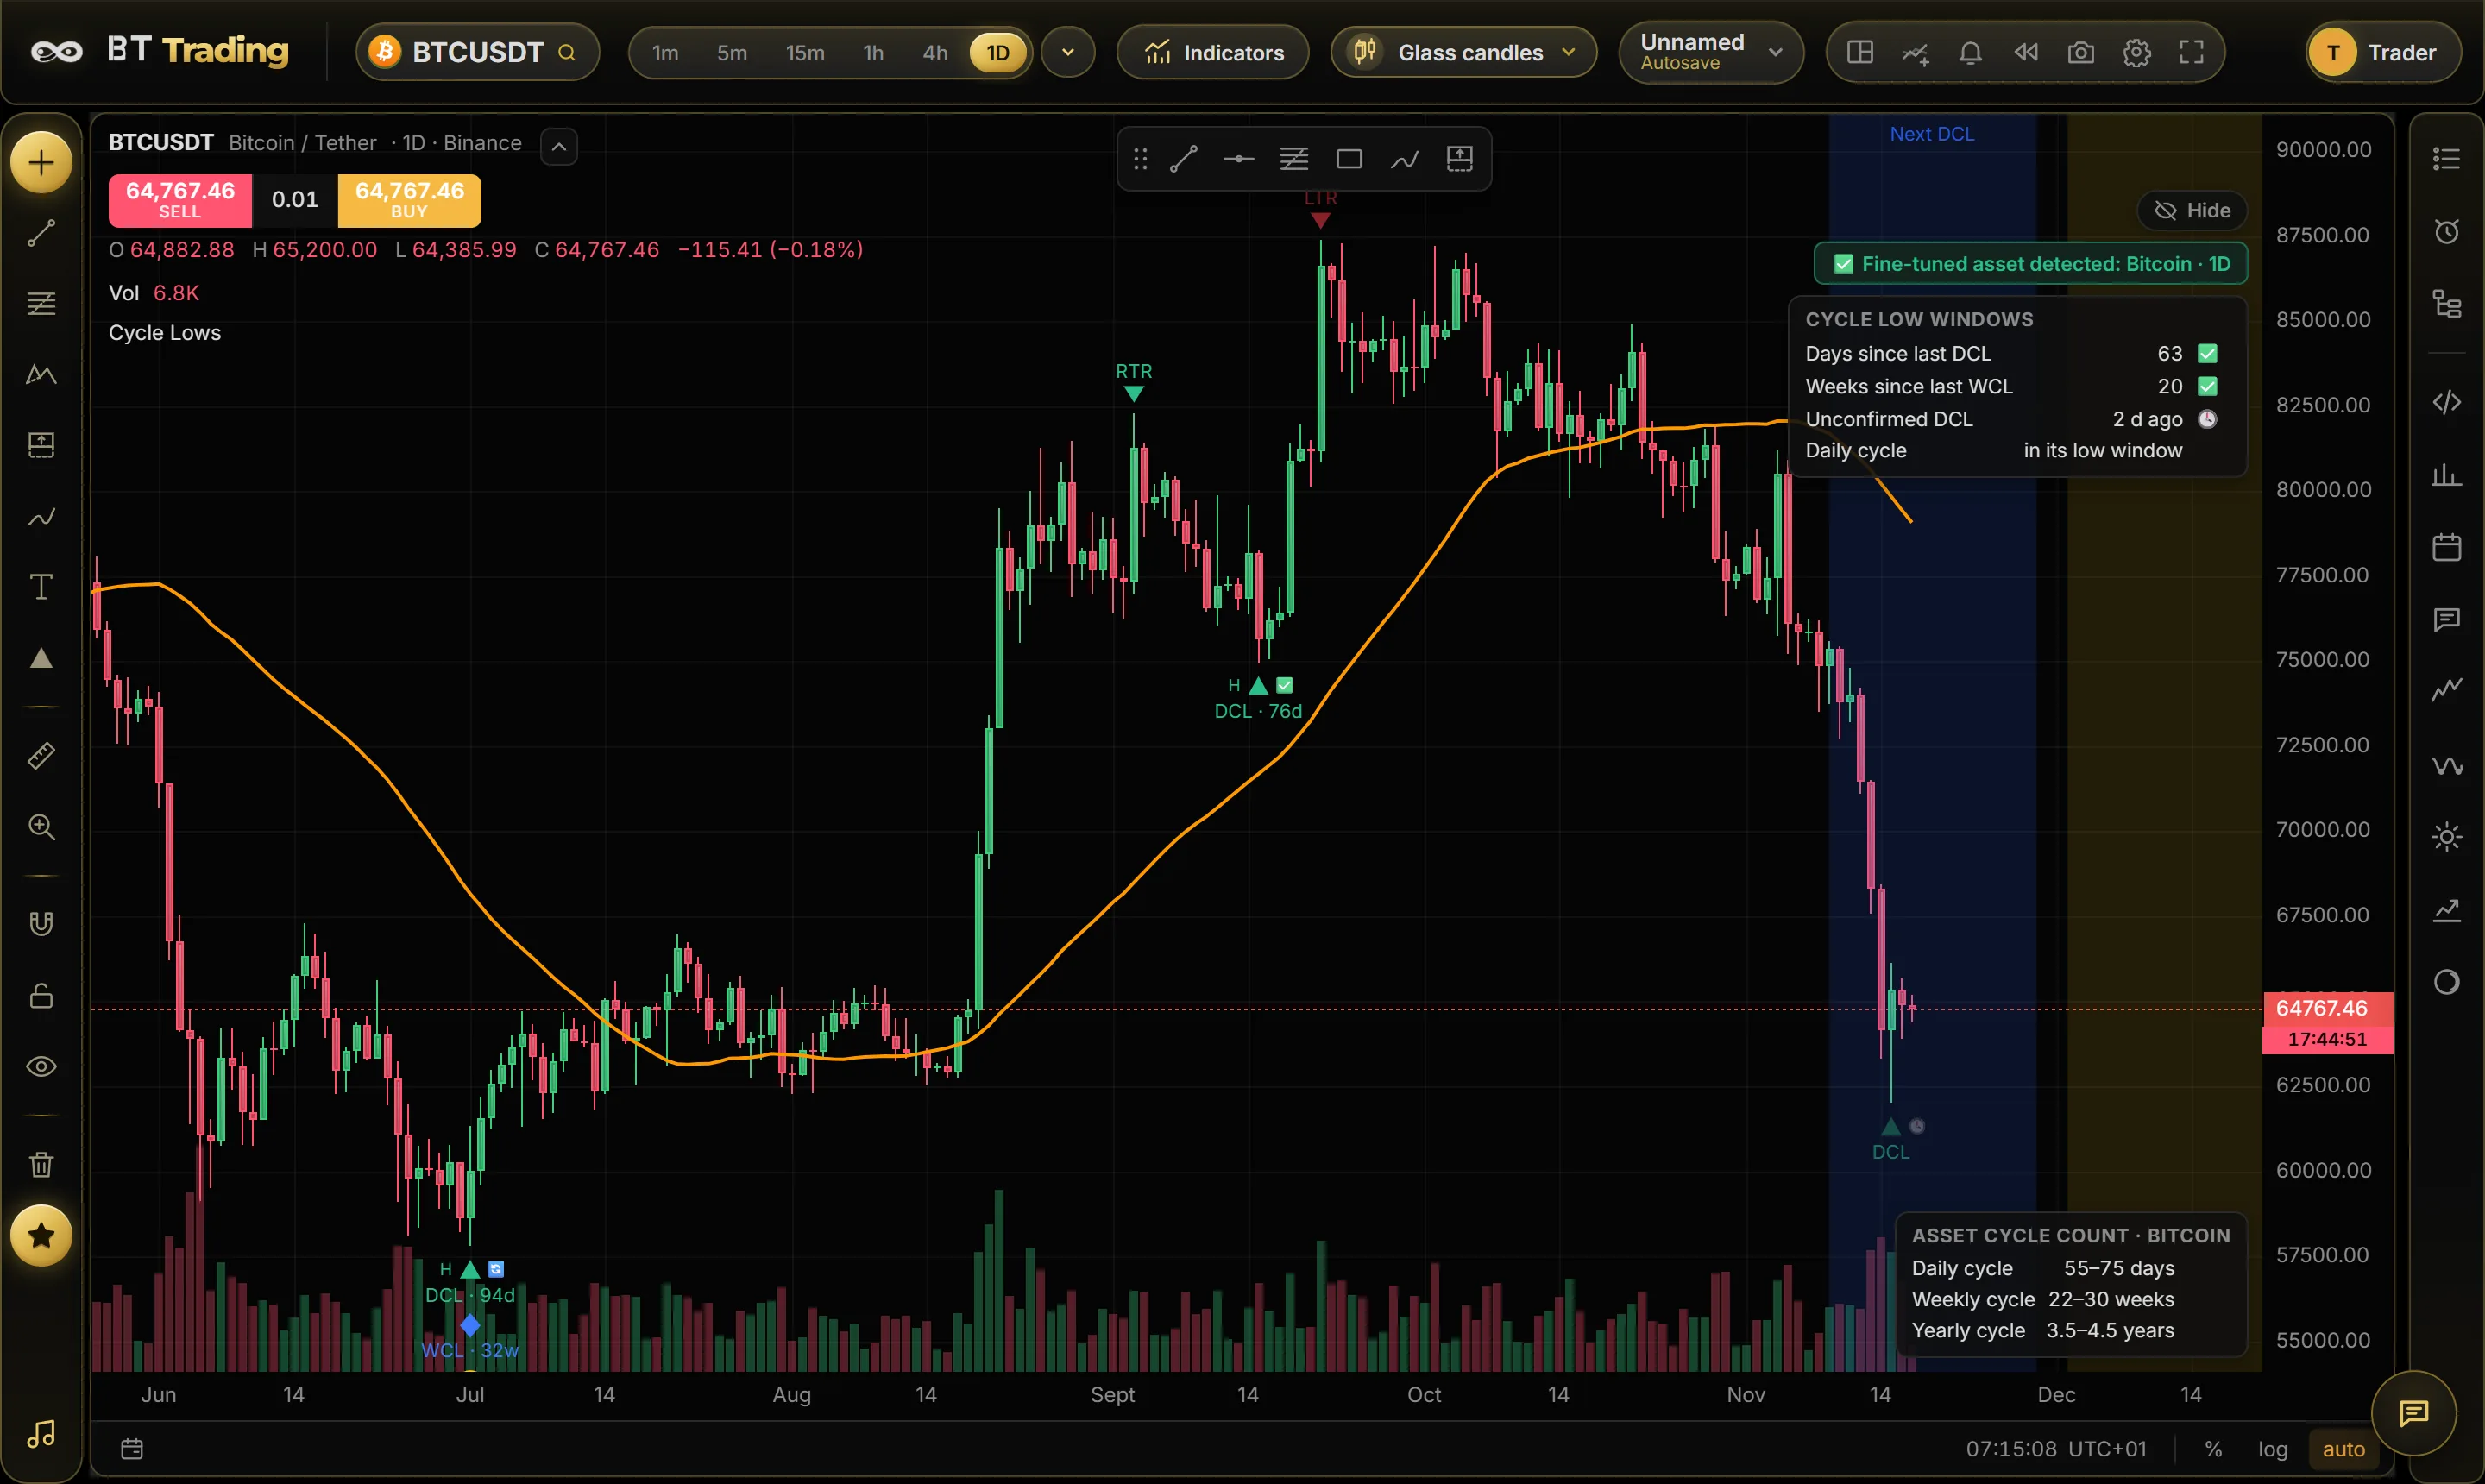
Markets don’t move in straight lines: they rise and fall in waves of roughly regular length. Cycle traders time those waves by their lows, because lows come at a steadier rhythm than tops. The Cycle Lows indicator in BT Trading finds those lows for you, marks them on the chart and shows when the next one is due.
The three cycles
- Daily Cycle Low (DCL): the low of each short cycle. For Bitcoin a daily cycle usually lasts about 55–75 days; for the S&P 500 about 36–48 trading days.
- Weekly Cycle Low (WCL): the lowest DCL of a medium cycle, usually 22–30 weeks. A weekly cycle is made of several daily cycles (often 3–4, sometimes 2 or 5).
- Yearly Cycle Low (YCL): the lowest WCL of the long cycle, about 3.5–4.5 years for Bitcoin and the stock market. These are the big, once-in-a-cycle buying chances.
These lengths are typical ranges from cycle-trading practice. BT Trading has fine-tuned ranges for Bitcoin, Ethereum, Solana, XRP, the S&P 500, the Nasdaq 100, the Dow Jones and more, and picks the right one for your chart by itself (you see “Fine-tuned asset detected” at the top right). You can change every range in the indicator’s settings.
When is a low a low?
A low is only clear after price has turned up from it. The indicator marks each low with its status:
- ✅ Confirmed: for a DCL, price closed back above the fast moving average while it turned up; a WCL is confirmed above the slow average, a YCL above a long one.
- 🕓 Unconfirmed: the lowest point so far, still forming. It can still be replaced by a lower low.
- ❌ Cancelled: price closed below the low too early in the next cycle, so it wasn’t the real cycle low.
- 🔄 Updated: a new low replaced a cancelled one.
Each confirmed DCL also gets a confluence grade H / M / L (high, medium, low) from three checks at the moment of confirmation: a breakout, momentum and support.
Cycle translation: is the cycle strong or weak?
Where a cycle tops between its two lows tells you a lot about the trend:
- Right-translated (RTR): the top came late in the cycle. Buyers stayed in control for most of it: a bullish sign.
- Mid-translated (MTR): the top came around the middle: neutral.
- Left-translated (LTR): the top came early and price fell for most of the cycle: a bearish sign. A close below the cycle’s starting low makes the running cycle left-translated at once.
The next low window
From the length of past cycles, the indicator shades the window where the next low is due on the right of the chart (“Next DCL”, “Next WCL”). When price falls into that window, a low is likely close; when it is far away, a dip is more likely to be a pullback inside the cycle. The table at the top right shows the count: days since the last DCL, weeks since the last WCL, and whether the daily cycle is in its low window.
How to use it, step by step
- Open BT Trading and pick a market, for example BTCUSDT or the S&P 500.
- Switch the chart to the 1D (daily) timeframe: the indicator is made for daily candles.
- Click Indicators, type cycle and pick Cycle Lows.
- Read the markers (DCL, WCL, YCL with ✅ 🕓 ❌), the translation icons above each top and the shaded next-low window.
- Double-click the indicator to change its settings, or right-click it to add an alert for new cycle lows.
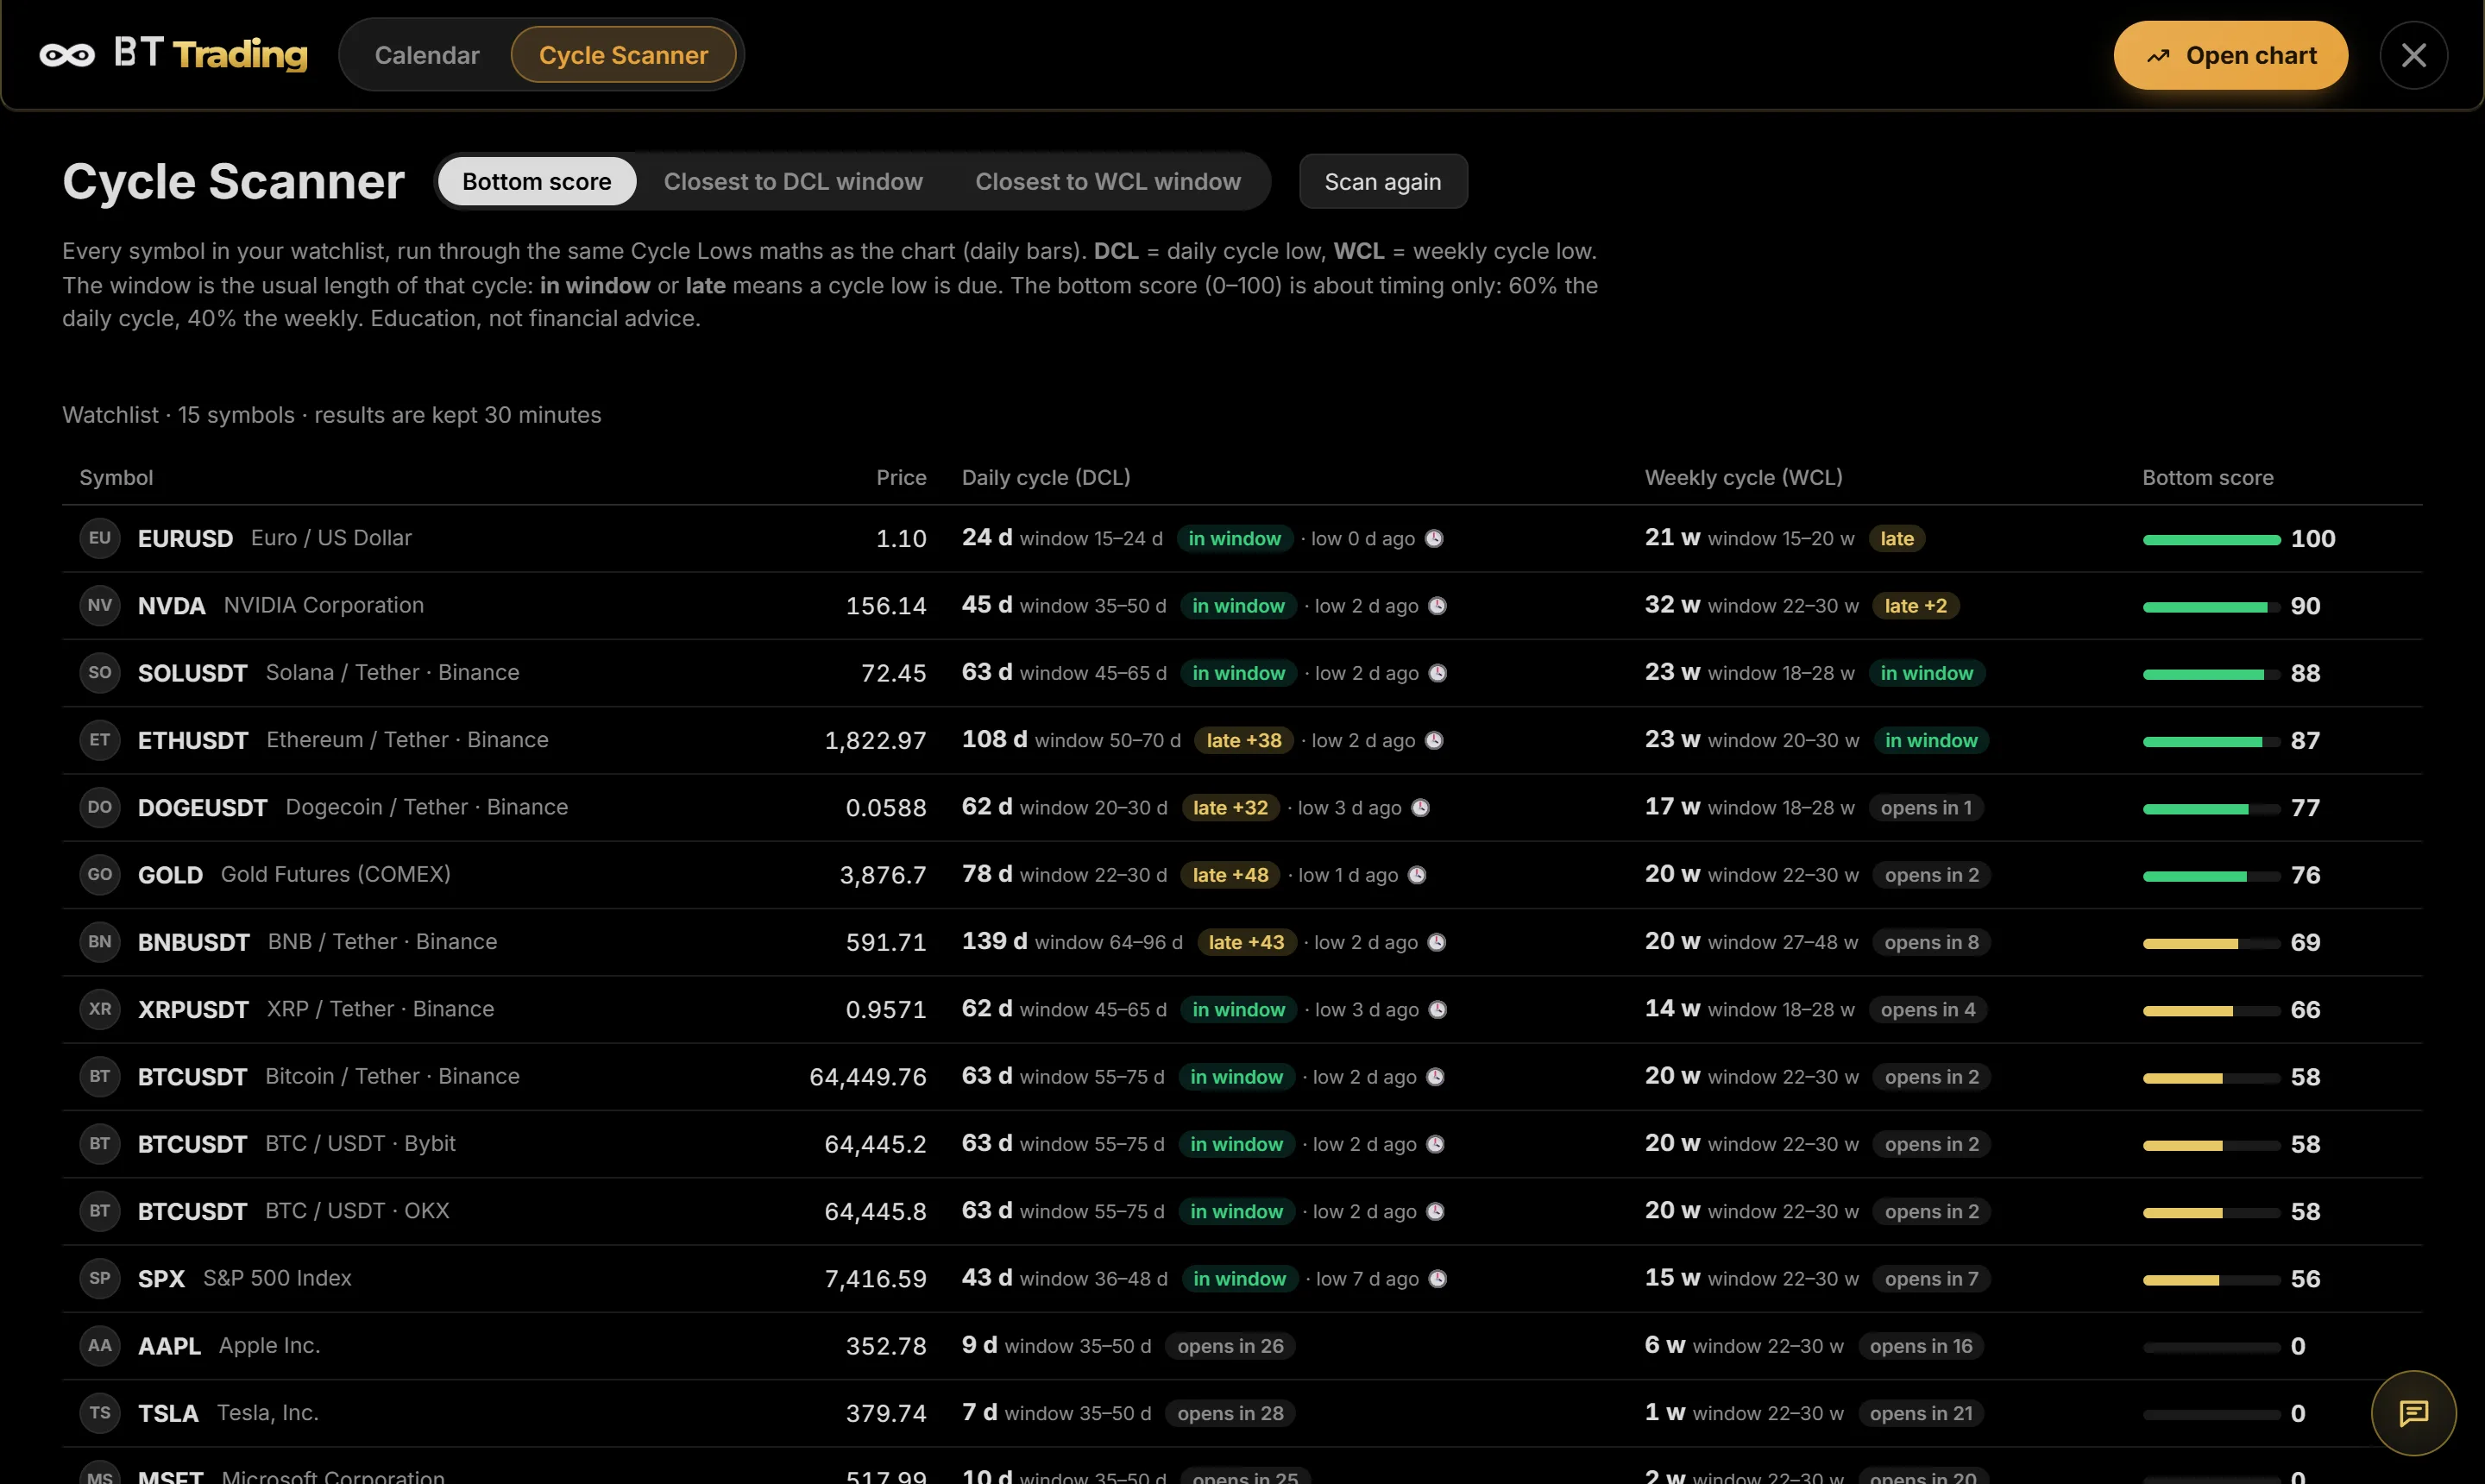
- Open the Cycle Scanner from the main menu to rank your whole watchlist by where each market is in its cycle.
Good to know
- Cycles give timing, not certainty. Use them with price action, support and your own risk rules.
- A long cycle can stretch or shrink; a cancelled low is part of the method, not a failure.
- On other timeframes the indicator still works roughly, but the daily chart is what it is tuned for.
Try it on a live chart
Open BT Trading in your browser: watch the charts free for 5 minutes without an account, or create a free account and get 5 days of Pro, with no card needed.
More guides
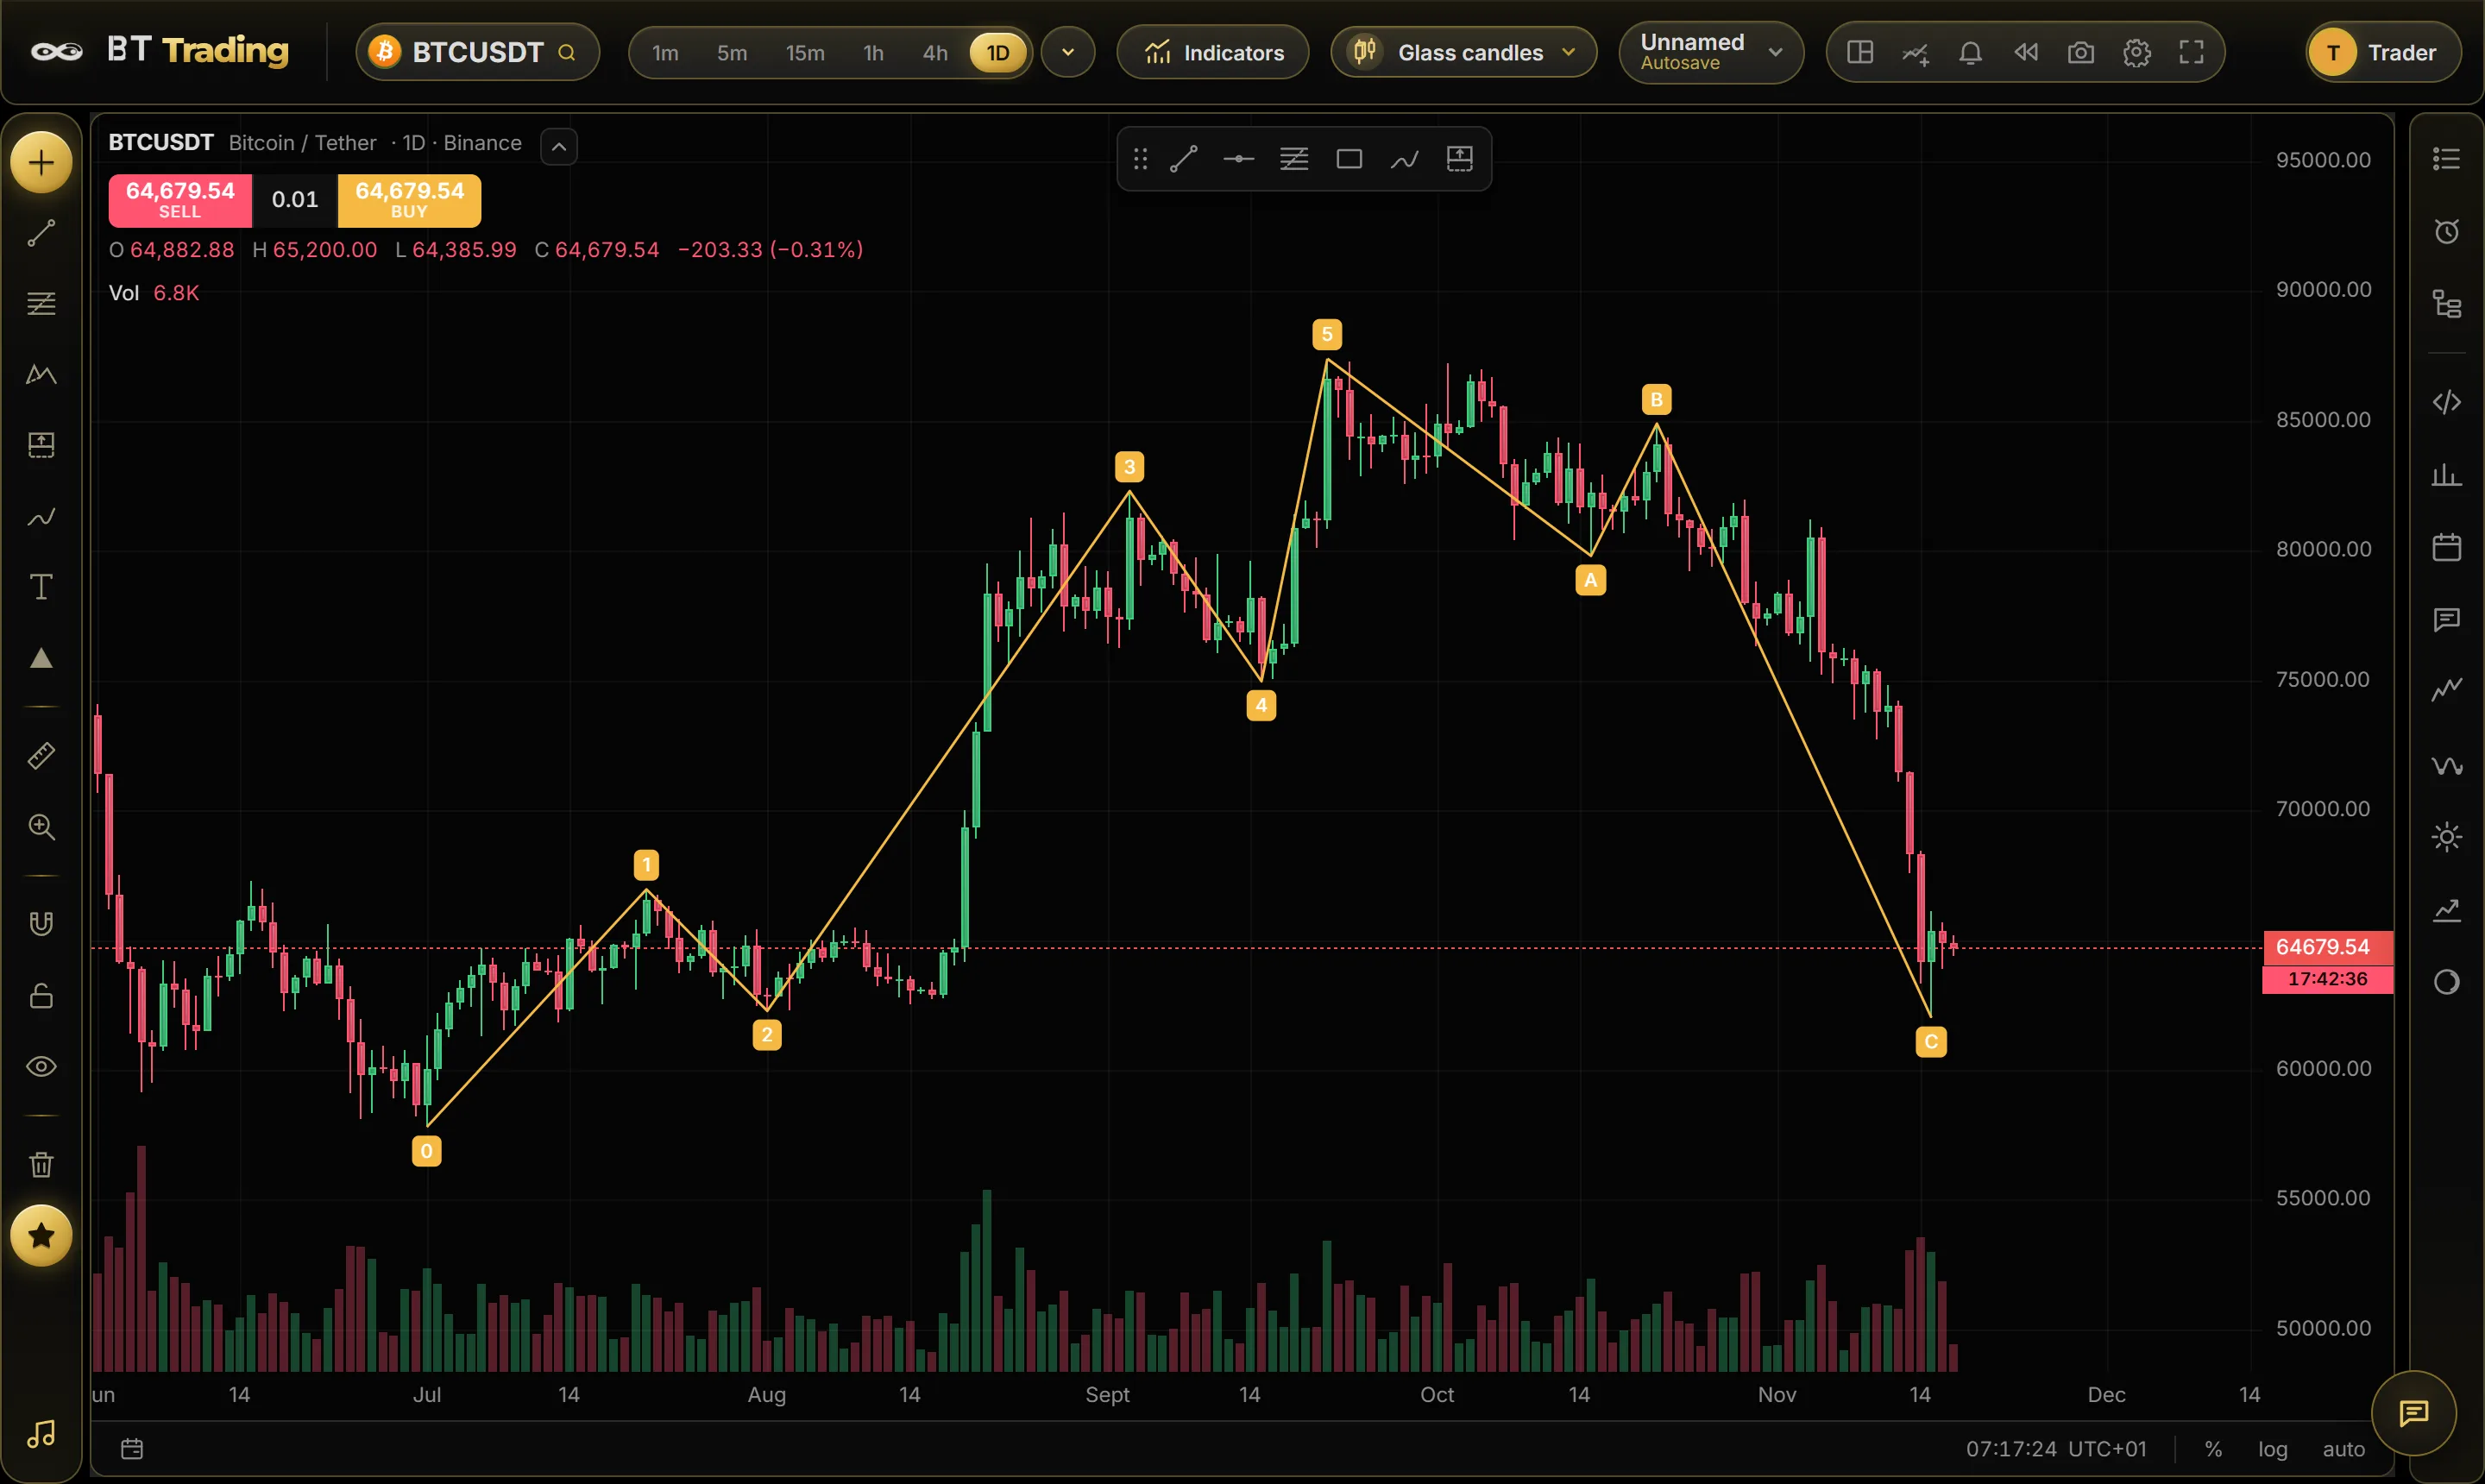 Elliott Wave rules explainedThe three hard Elliott Wave rules, the most useful guidelines (Fibonacci ratios, alternation), corrections (zigzag, flat, triangle) and how …
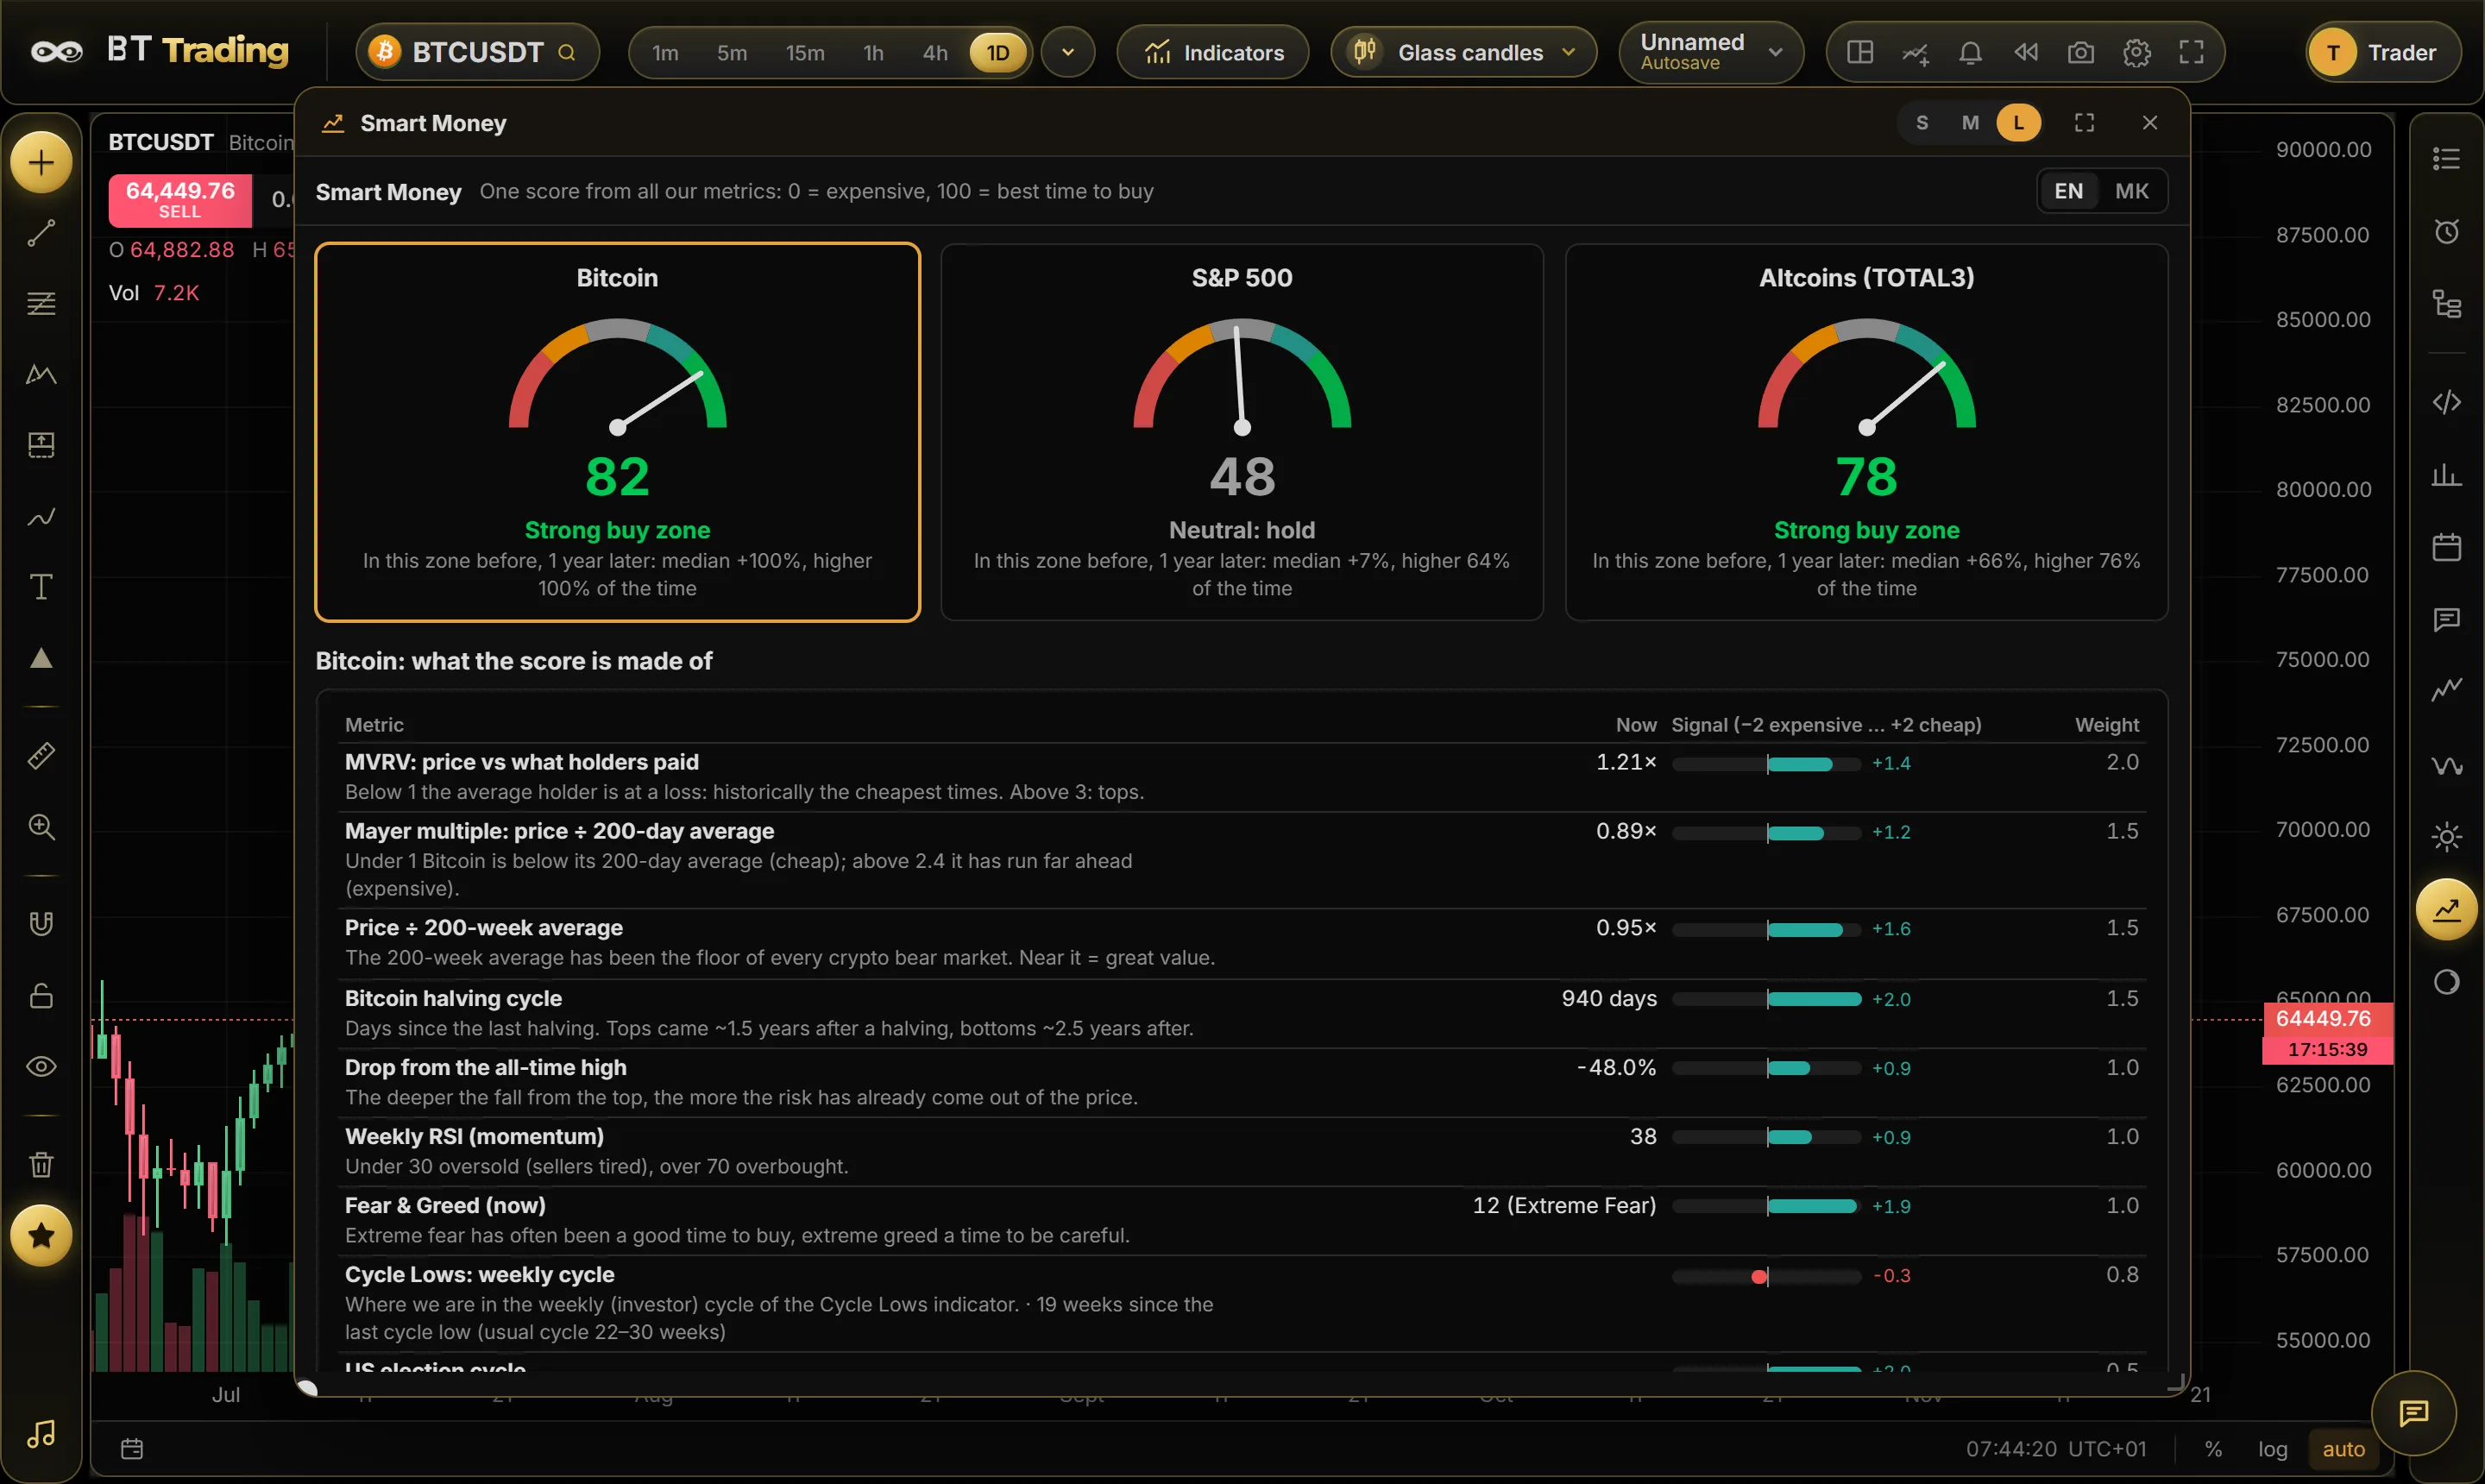 What the Smart Money score isHow BT Trading’s Smart Money score works: one 0–100 number from valuation, cycles, momentum and sentiment for Bitcoin, the S&P 500 and altco…