BT Trading Hub › Learn › Elliott Wave rules explained
Elliott Wave rules explained: the 3 rules, the guidelines and how to count waves
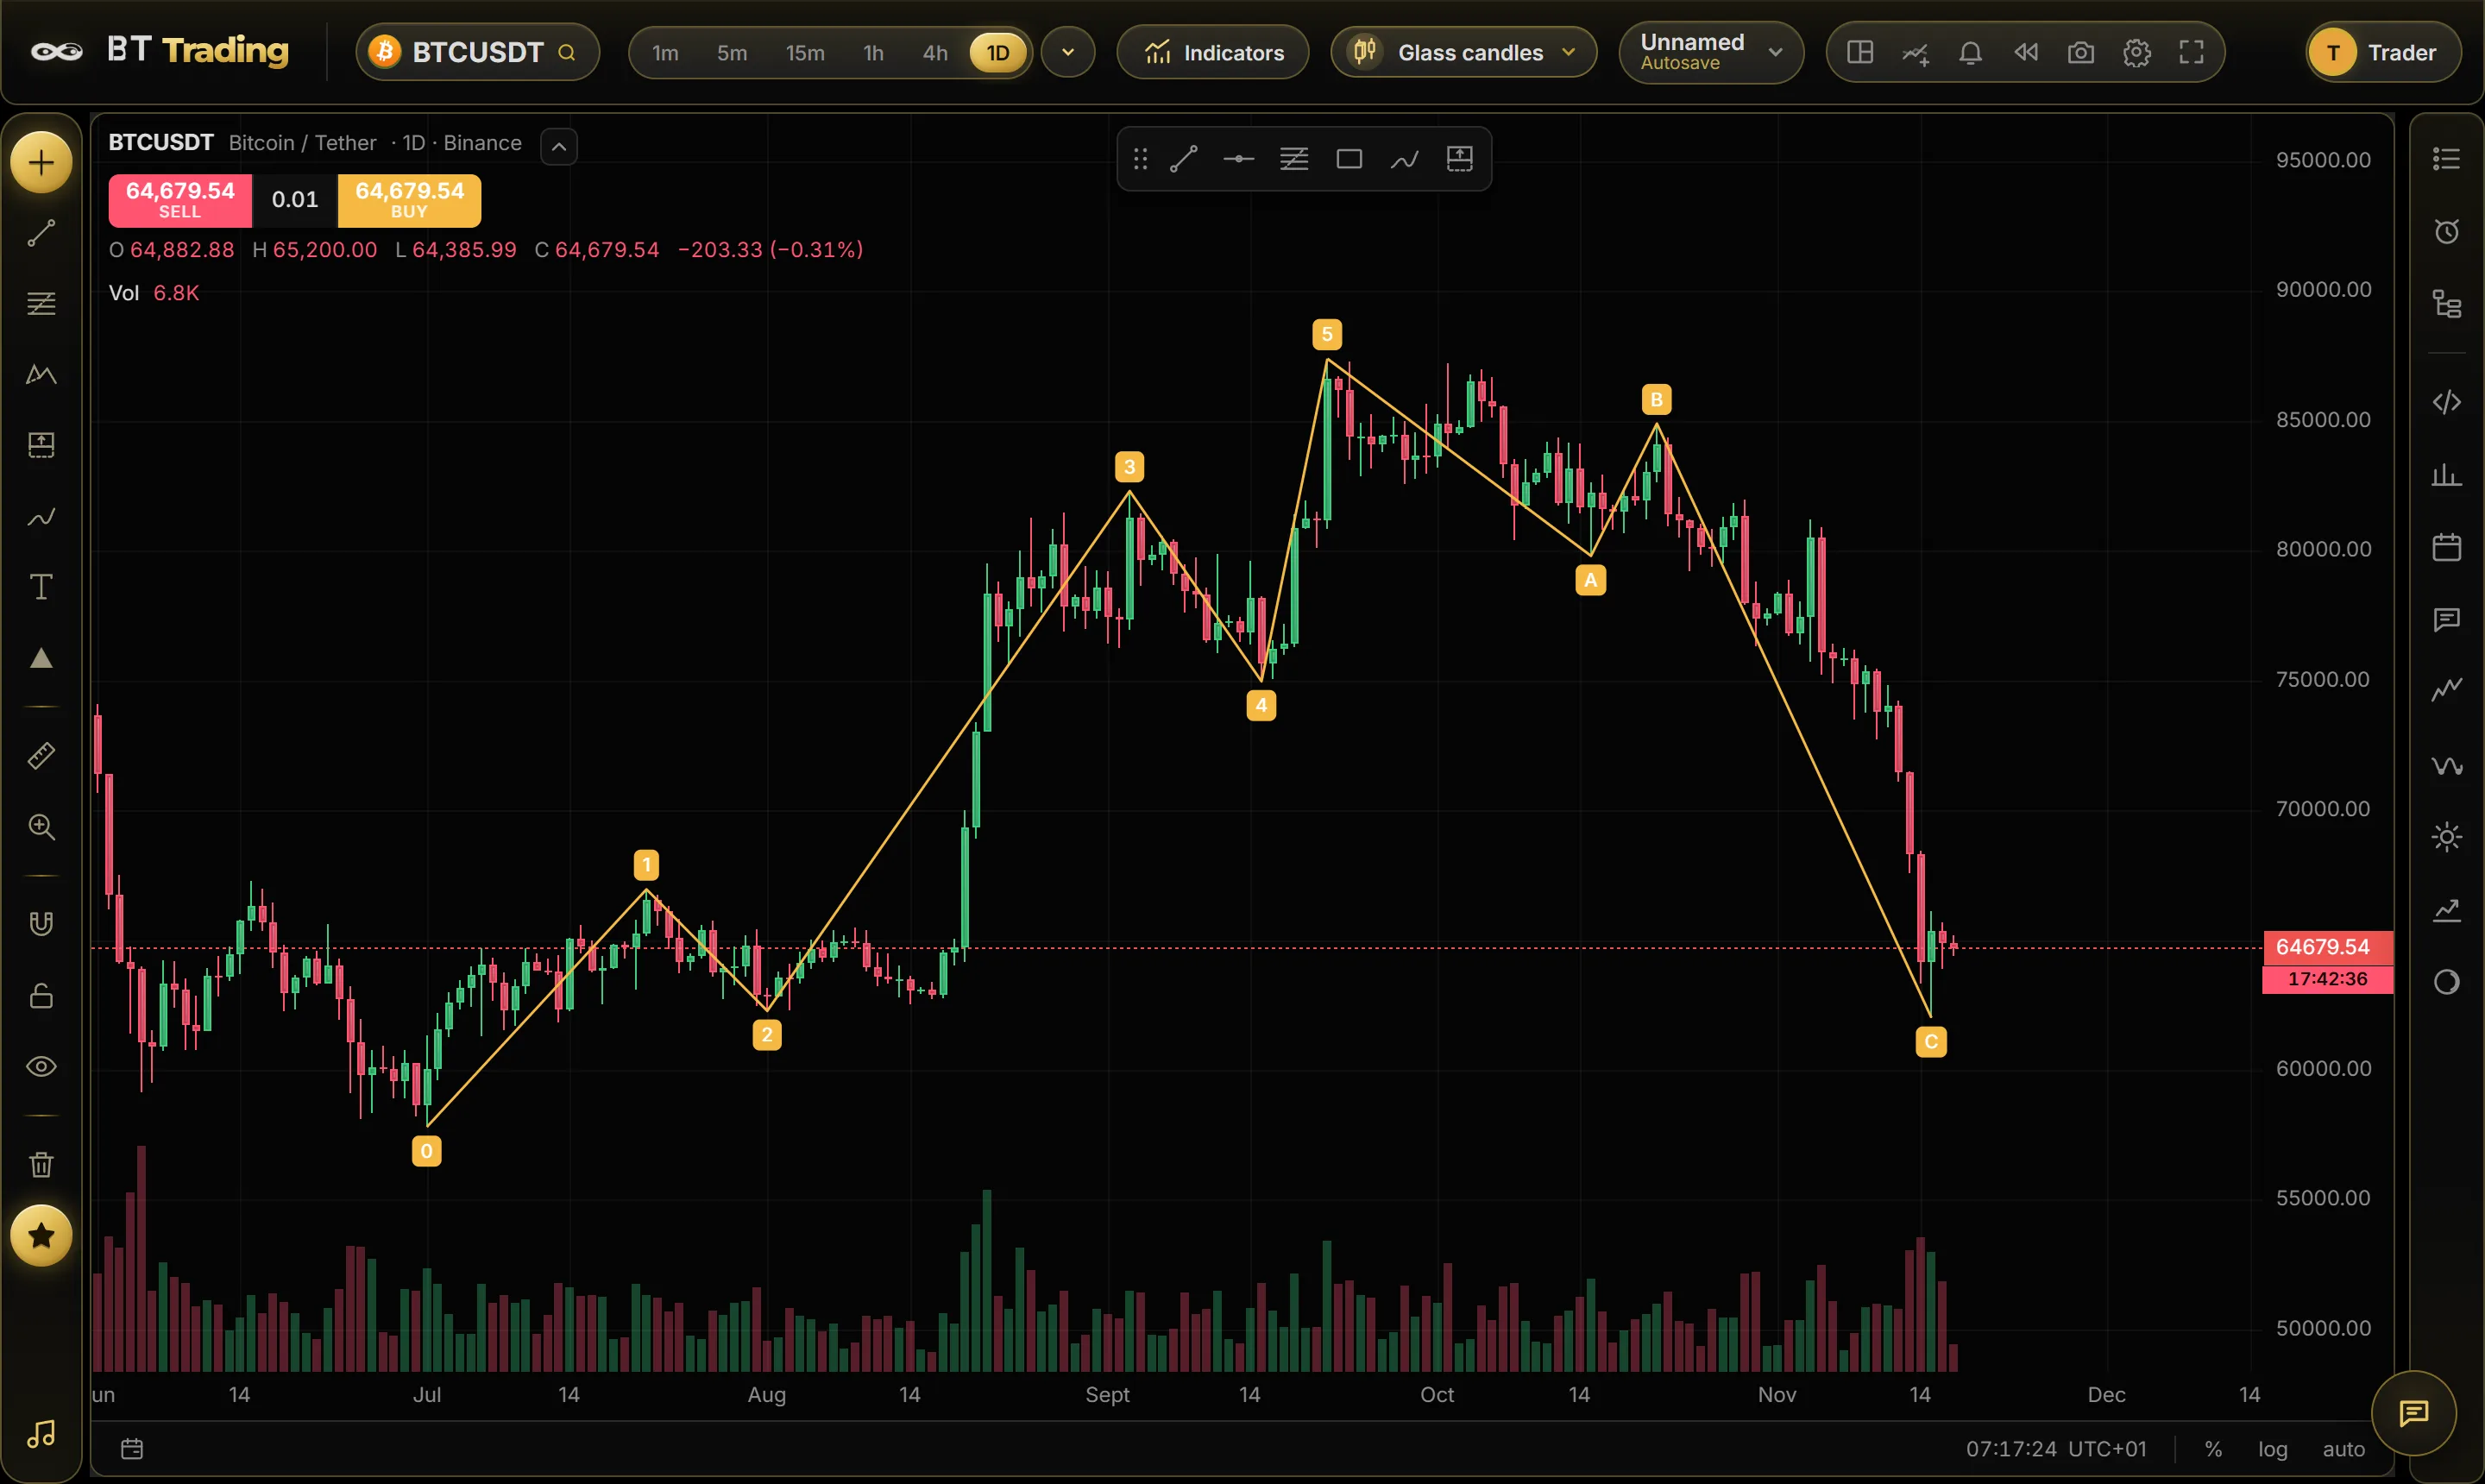
The Elliott Wave principle says that crowds move markets in repeating patterns: five waves in the direction of the trend, then three waves against it. Counting those waves helps you see where you are in a move, and where the next turn may come. But a wave count is only valid if it follows the rules.
The impulse: 1-2-3-4-5
An impulse has five waves. Waves 1, 3 and 5 go with the trend; waves 2 and 4 are pauses against it. After the impulse, a correction (usually A-B-C) takes back part of the move.
The three rules that can never break
- Wave 2 never goes beyond the start of wave 1. In an uptrend, wave 2 must stay above the low where wave 1 began.
- Wave 3 is never the shortest of waves 1, 3 and 5. It is often the longest and strongest.
- Wave 4 never enters the price range of wave 1. In an uptrend, the low of wave 4 stays above the top of wave 1 (diagonals are the exception).
If one of these breaks, the count is wrong: count again.
Guidelines (usual, not required)
- Wave 2 often retraces 50–61.8% of wave 1.
- Wave 3 is often 1.618 times wave 1.
- Wave 4 often retraces about 38.2% of wave 3.
- Wave 5 is often about as long as wave 1, or 0.618 of the distance from the start of wave 1 to the end of wave 3.
- Alternation: if wave 2 is sharp, wave 4 is often flat and sideways, and the other way round.
Corrections
- Zigzag (A-B-C, 5-3-5): a sharp correction; B doesn’t get back near the start of A.
- Flat (3-3-5): a sideways correction; B comes back close to where A started.
- Triangle (A-B-C-D-E): a narrowing range, usually just before the last wave of a move.
- Combinations (W-X-Y, W-X-Y-X-Z): two or three simple corrections joined together.
How to draw and check a wave in BT Trading
- Open a chart, for example BTCUSDT on the 1D timeframe.
- In the drawing tools on the left, open the patterns group and pick an Elliott tool: impulse (12345), correction (ABC), triangle (ABCDE), double combo (WXY) or triple combo (WXYXZ).
- Click the points of the wave on the chart, starting at its origin (point 0). BT Trading labels each point.
- Open the Elliott Wave tab: it checks your wave against the rules and shows Fibonacci targets for the next wave, with a wave guide in English and Macedonian.
- Drag any point to adjust the count; the checks update at once.
Good to know
- There is often more than one valid count. Keep the one that follows all three rules and the most guidelines.
- Waves exist on every timeframe: a wave 3 on the daily chart is made of five smaller waves on the 4-hour chart.
- Combine wave counts with cycle timing: a wave 2 or 4 low that lands in a cycle-low window is a stronger setup.
Try it on a live chart
Open BT Trading in your browser: watch the charts free for 5 minutes without an account, or create a free account and get 5 days of Pro, with no card needed.
More guides
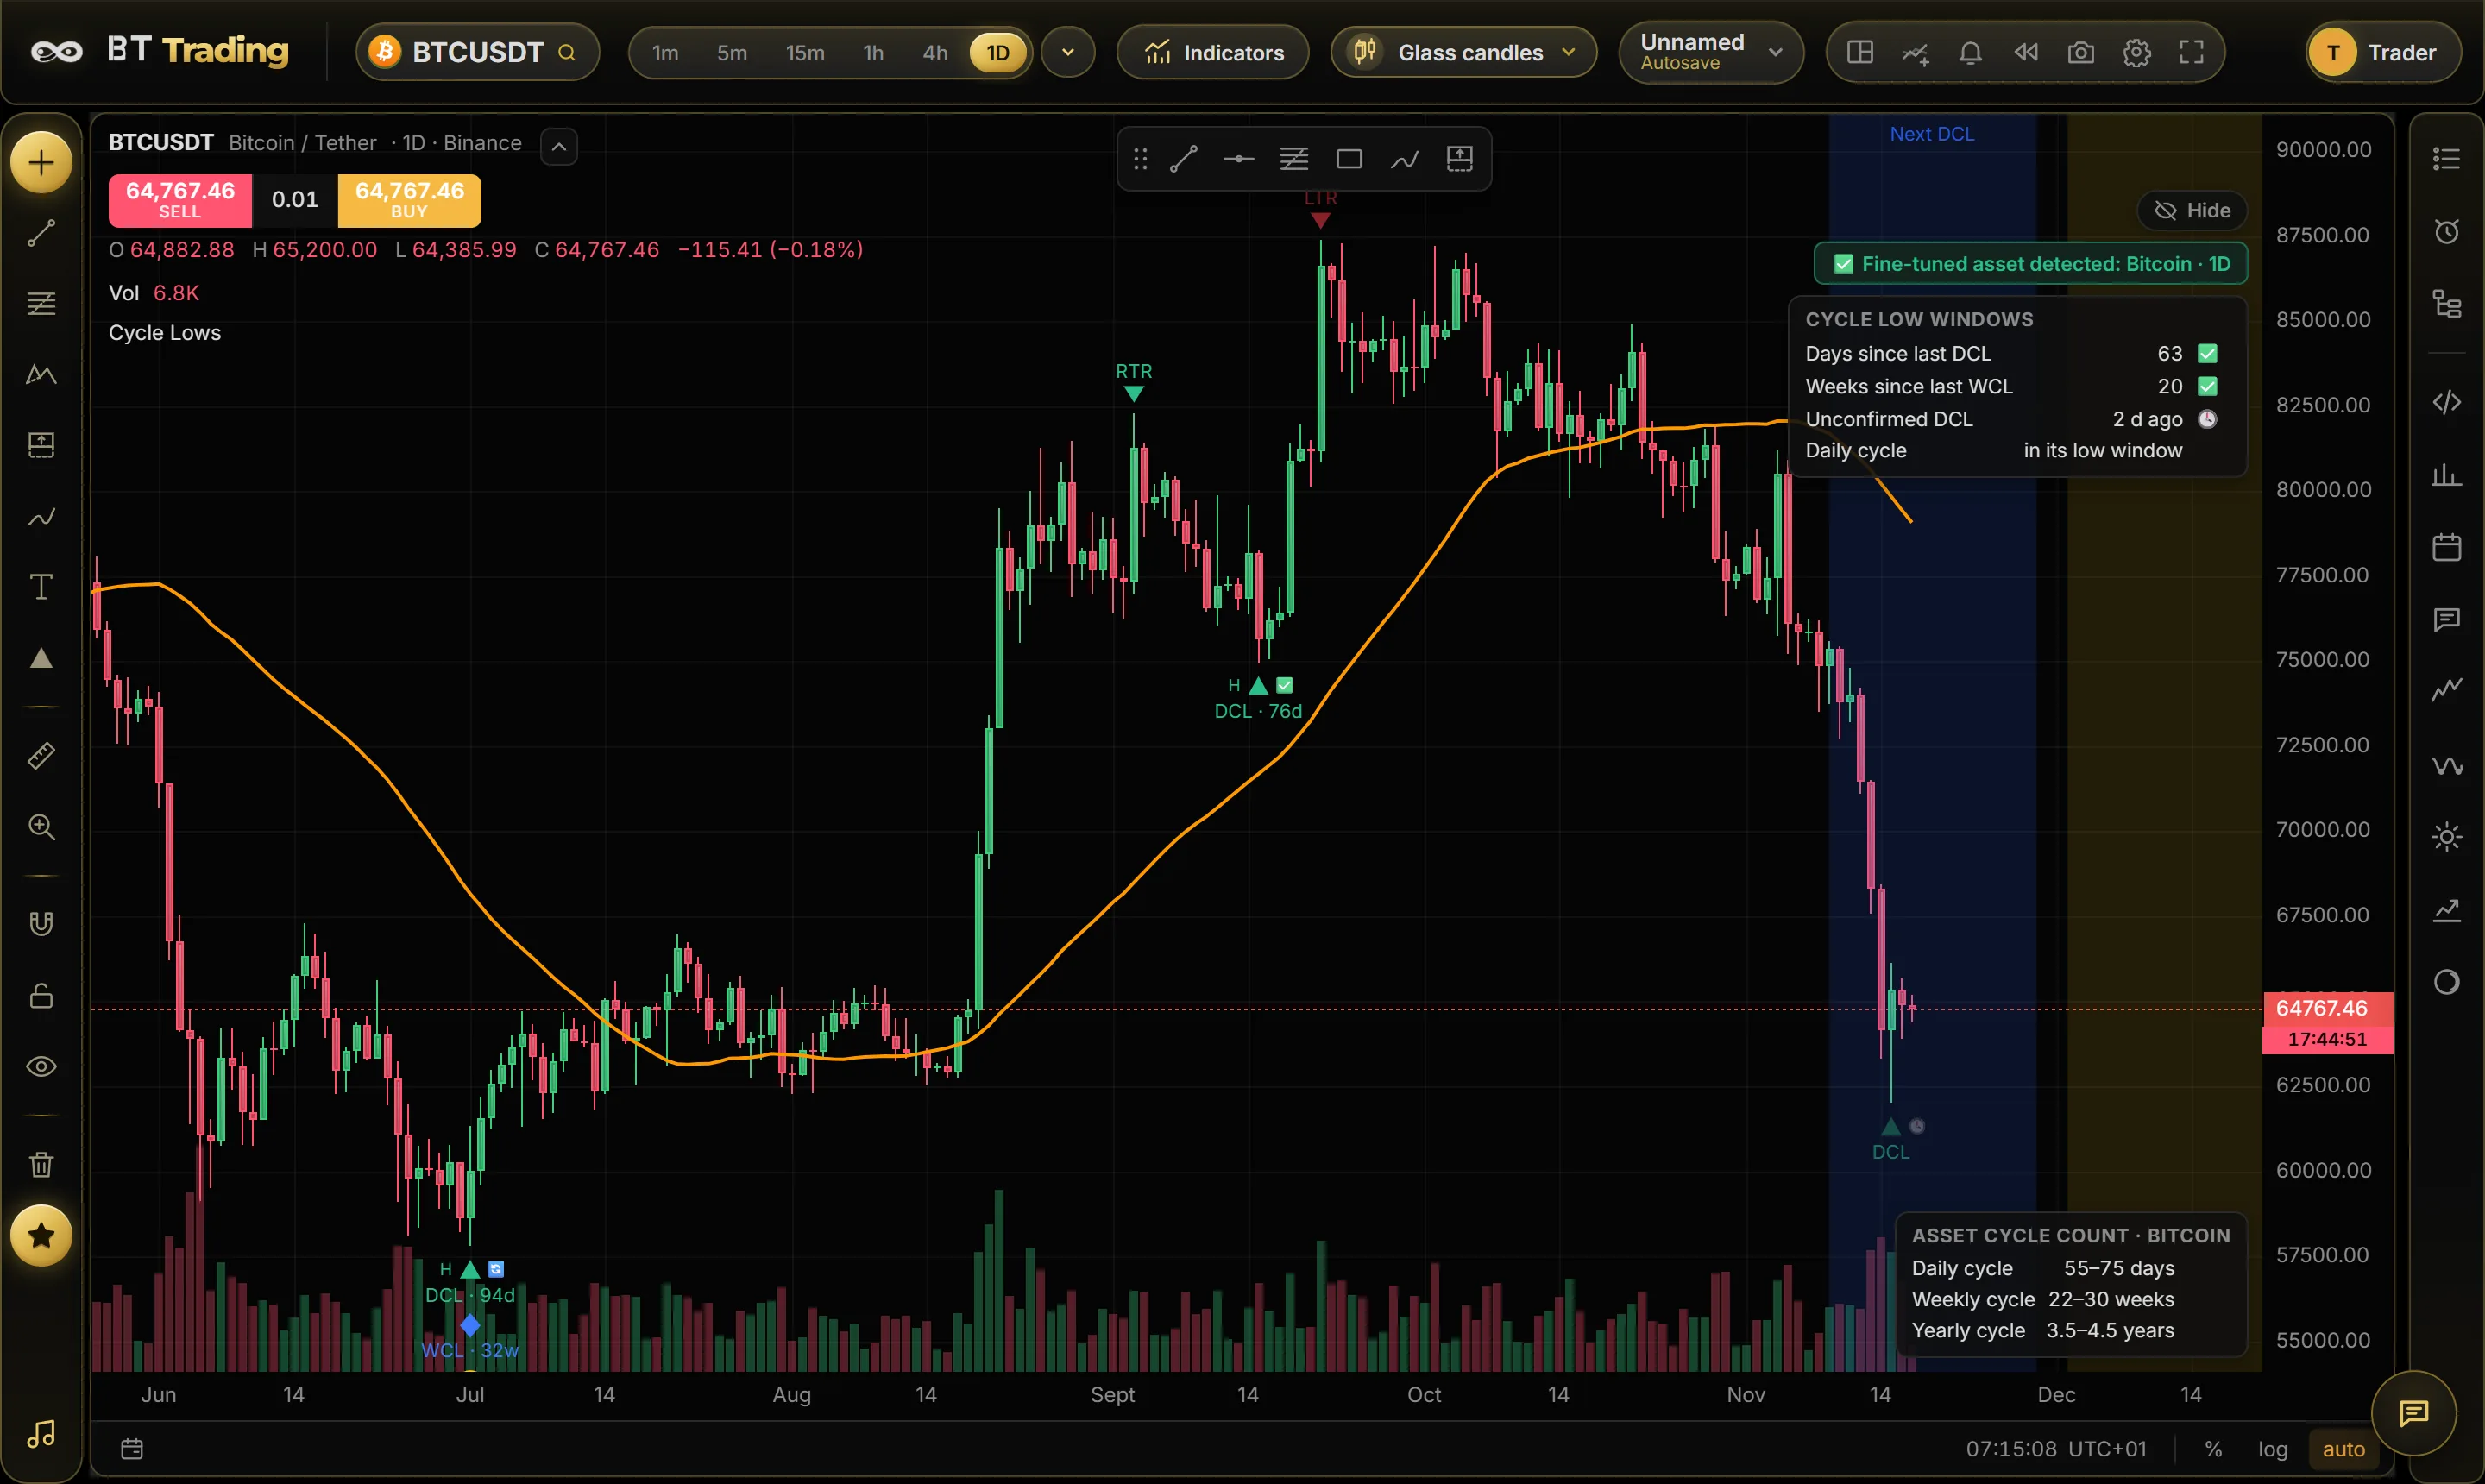 How to use Cycle LowsA step-by-step guide to cycle trading with the Cycle Lows indicator: what daily, weekly and yearly cycle lows are, how they are confirmed, w…
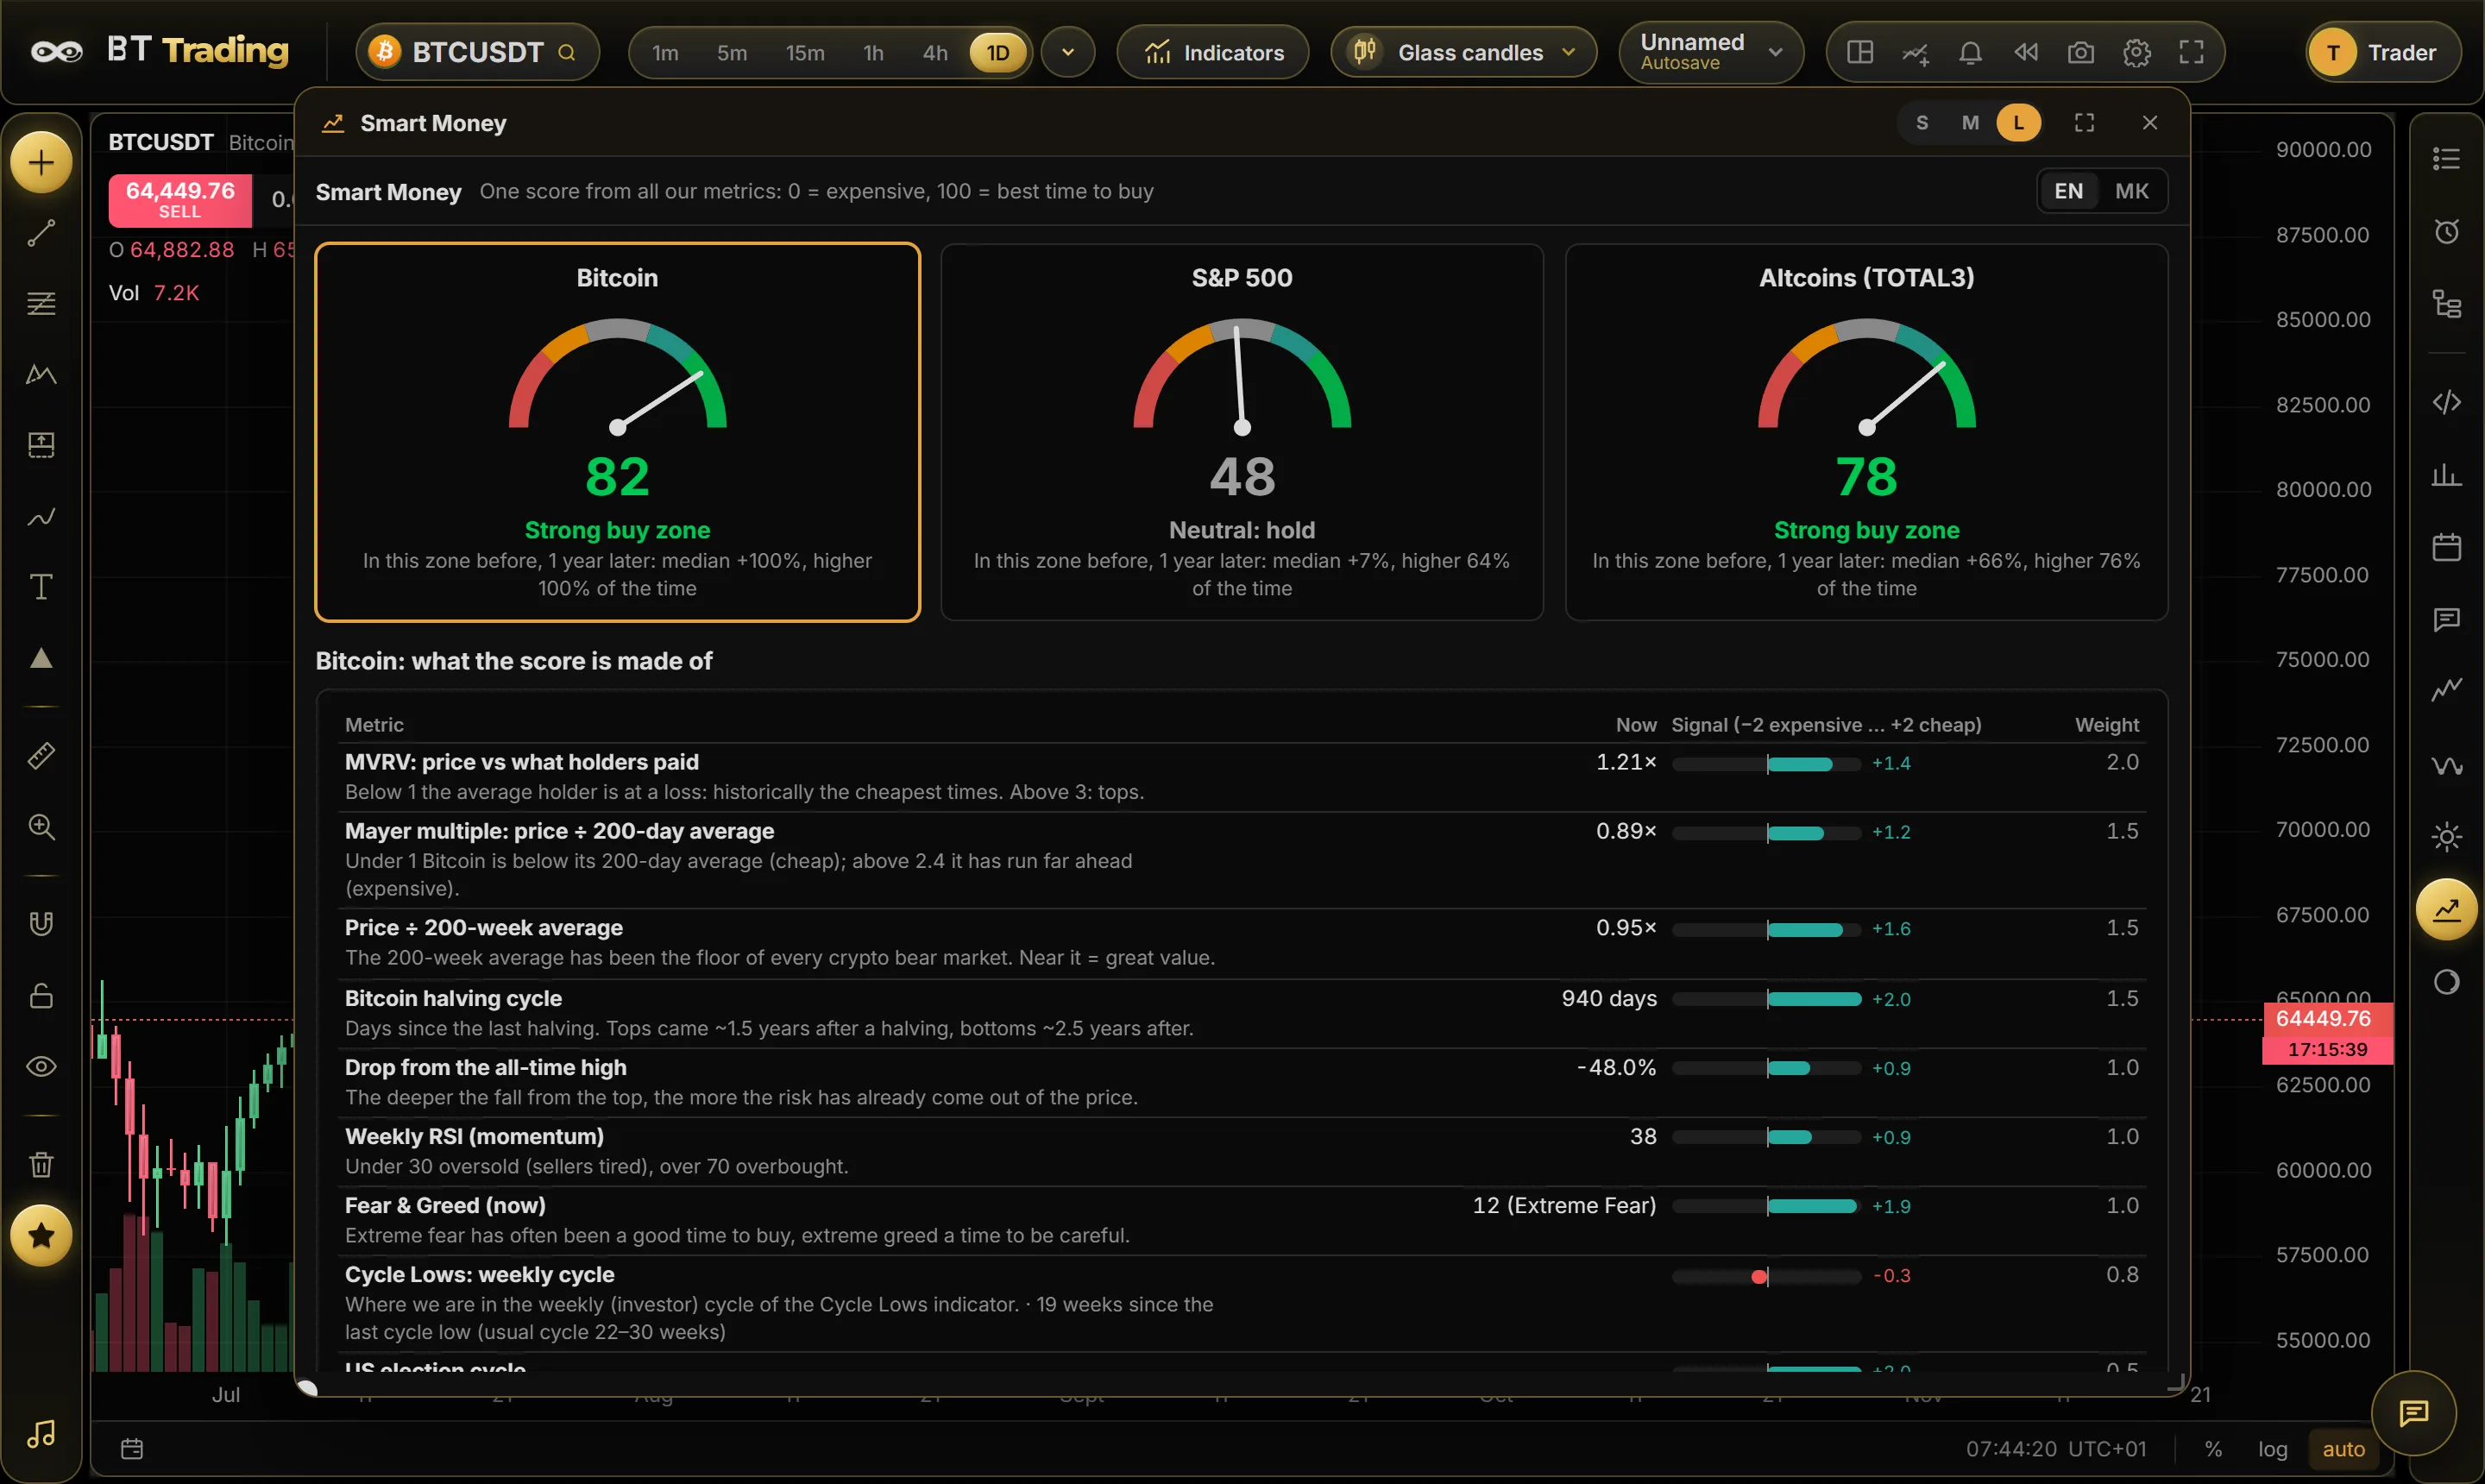 What the Smart Money score isHow BT Trading’s Smart Money score works: one 0–100 number from valuation, cycles, momentum and sentiment for Bitcoin, the S&P 500 and altco…