BT Trading Hub › Learn › What the Smart Money score is
The Smart Money score: when to invest in Bitcoin, the S&P 500 and altcoins
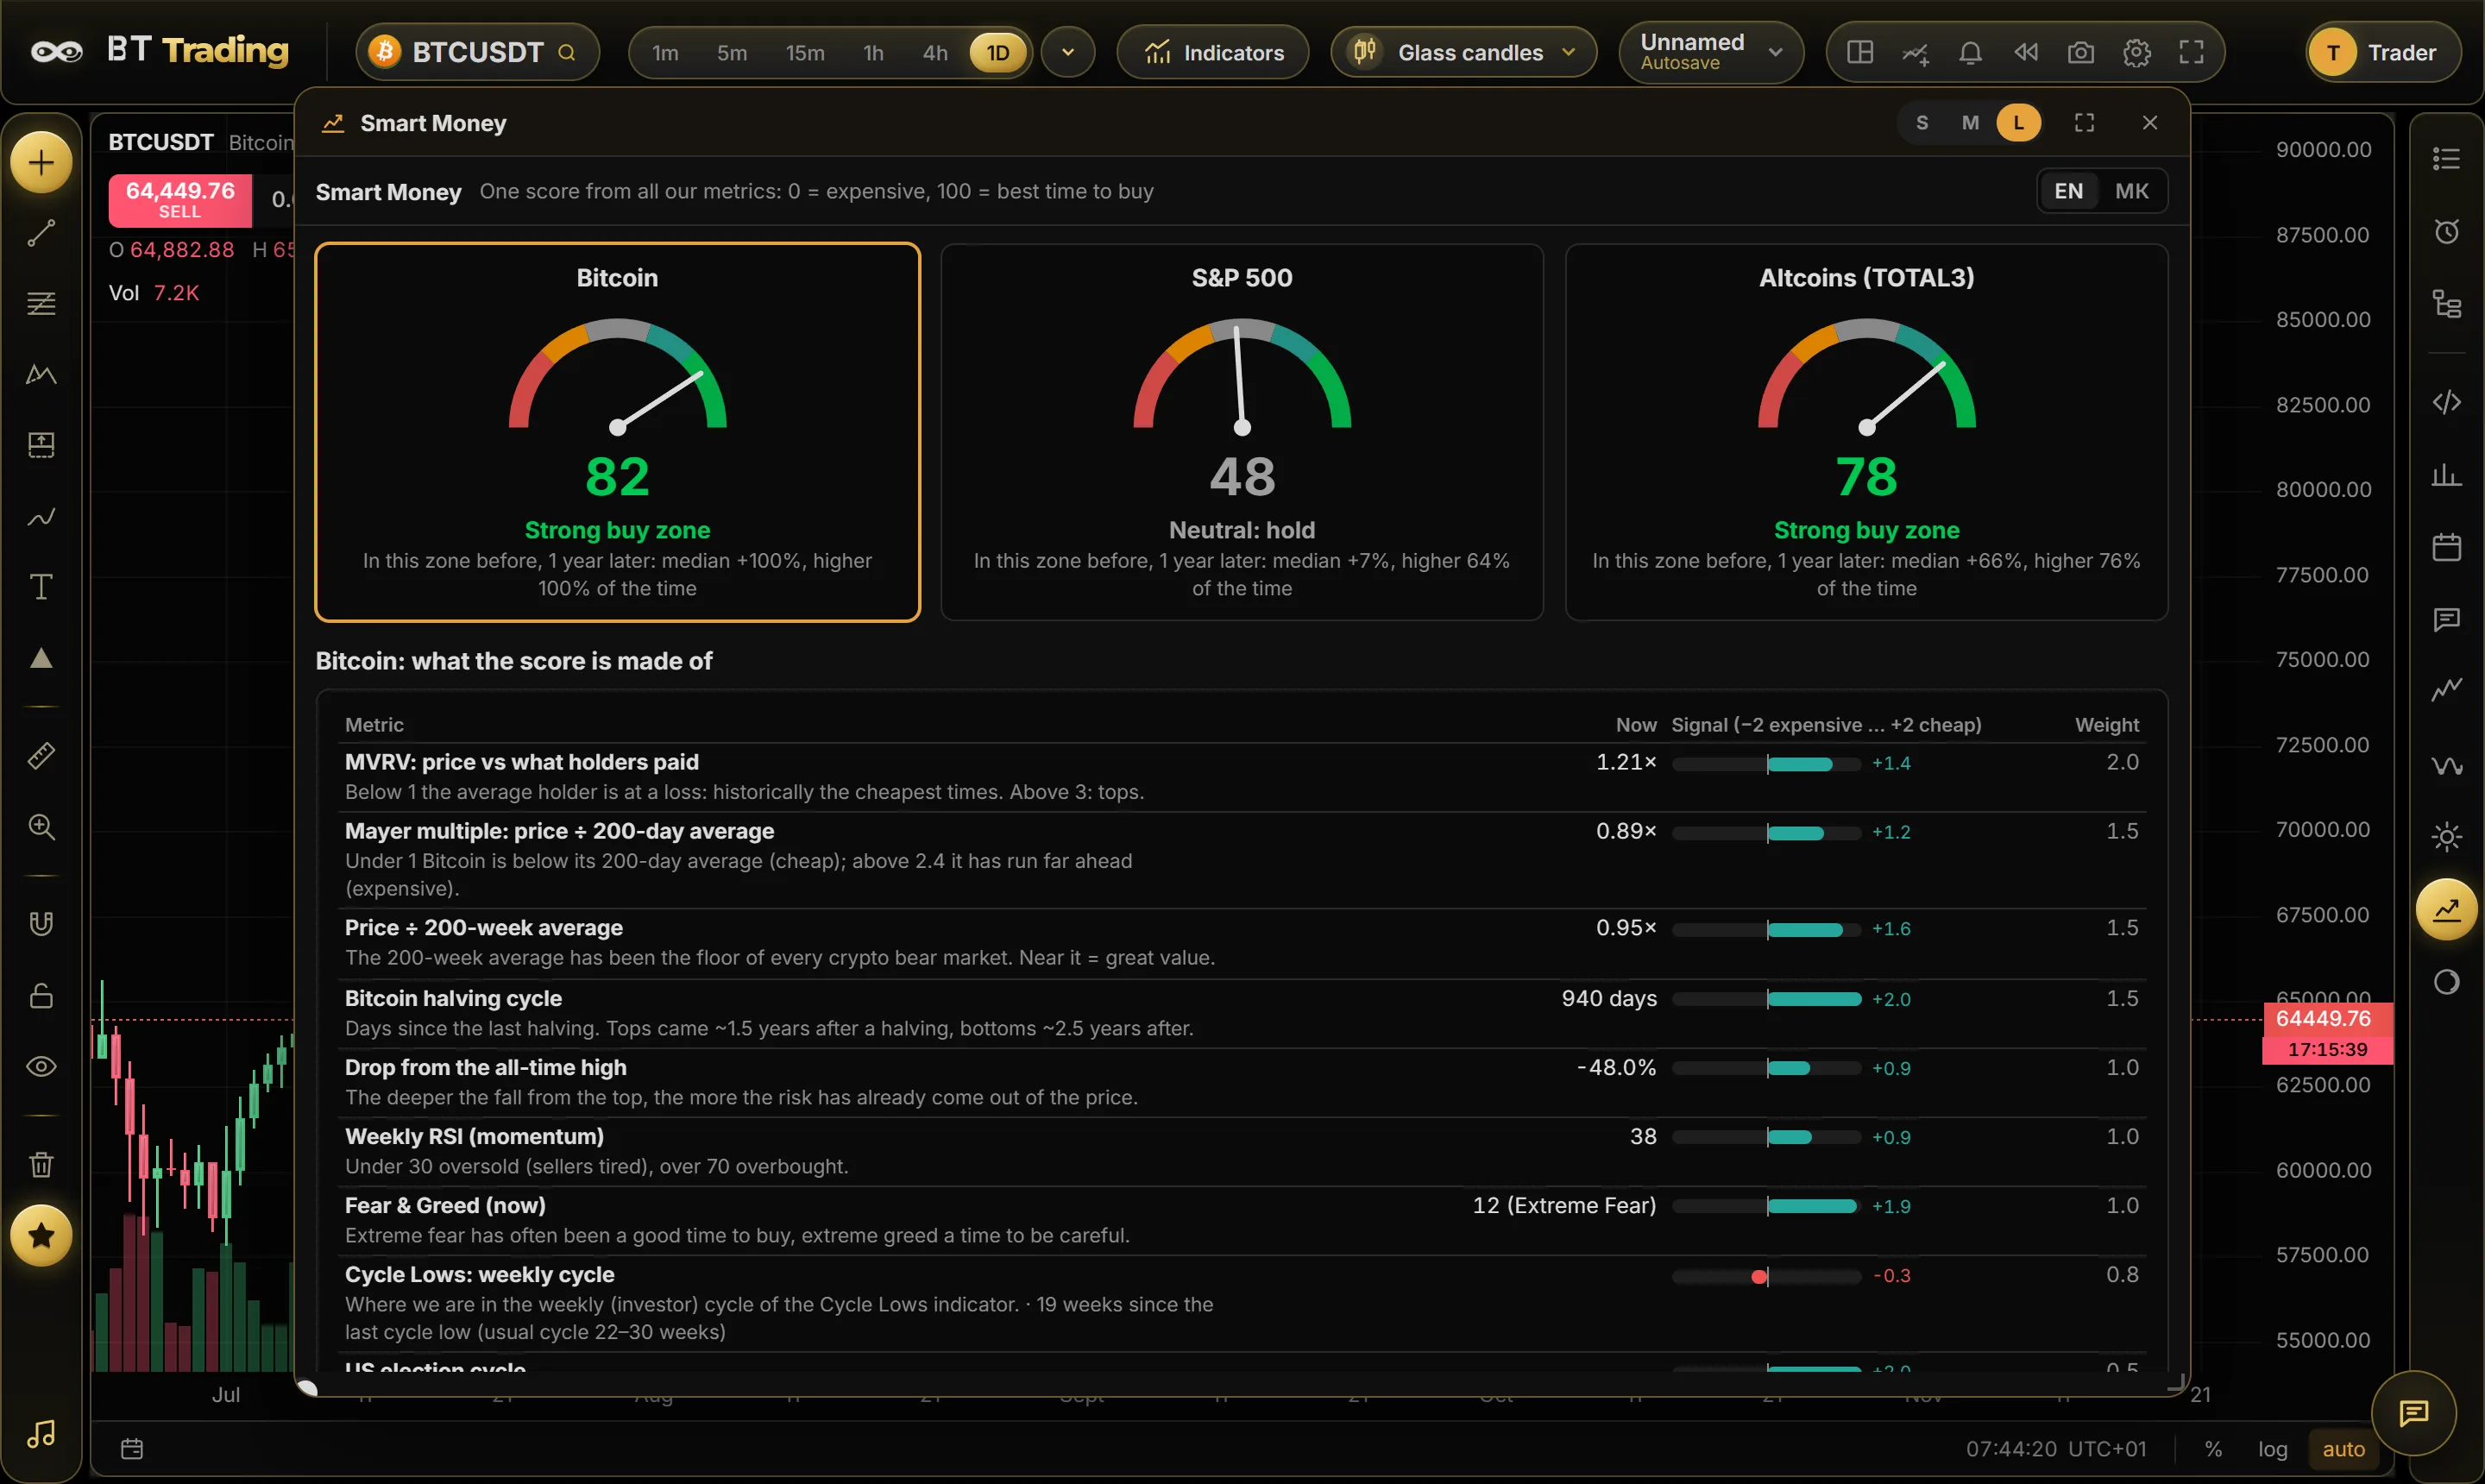
Most investors lose money by buying when everyone is excited and selling when everyone is scared. The Smart Money score turns the data that long-term investors watch into one number from 0 to 100: 0 means expensive (a time to be careful or take profits), 100 means the best time to buy.
Three scores
- Bitcoin
- The S&P 500 (the US stock market), with data back to 1871
- Altcoins (TOTAL3: the crypto market without Bitcoin and Ethereum)
What the score is made of
Each score adds up several factors. Every factor gives a signal from −2 (expensive) to +2 (cheap / a good time), and has its own weight. For Bitcoin, for example:
- MVRV: the price compared with what holders paid on average. Below 1, the average holder is at a loss: historically the cheapest times.
- Mayer multiple: the price divided by its 200-day average.
- Price ÷ 200-week average: the long-term floor of past bear markets.
- The halving cycle: days since the last Bitcoin halving. Past tops came about 1.5 years after a halving, bottoms about 2.5 years after.
- Drop from the all-time high, weekly RSI (momentum) and Fear & Greed.
- Cycle Lows (where the weekly cycle is), the US election cycle, the solar cycle and the Fed.
The S&P 500 score adds valuation (the Shiller CAPE compared with every month since 1881); the altcoin score adds Bitcoin dominance, because money moving out of Bitcoin often flows into altcoins.
The zones
- Strong buy zone · Good time to buy · Neutral: hold · Caution · Expensive: take profits
Under each score BT Trading shows its backtest: what happened one year later in the past, every time the score was in the same zone (the median change, and how often the price was higher).
How to use it
- Open BT Trading and click Smart Money in the right-hand bar.
- Read the three scores, then click one to see what it is made of: each factor, its value now, its signal and its weight.
- Use it for timing your long-term buying and selling, for example buying more in the buy zones and taking some profit in the expensive zone.
The landing page shows today’s three scores, and you can get them by email every Monday without an account.
Good to know
- The score is for long-term decisions (weeks to years), not for day trading.
- Past zones and their results don’t guarantee the future. It is information and education, not financial advice.
Try it on a live chart
Open BT Trading in your browser: watch the charts free for 5 minutes without an account, or create a free account and get 5 days of Pro, with no card needed.
More guides
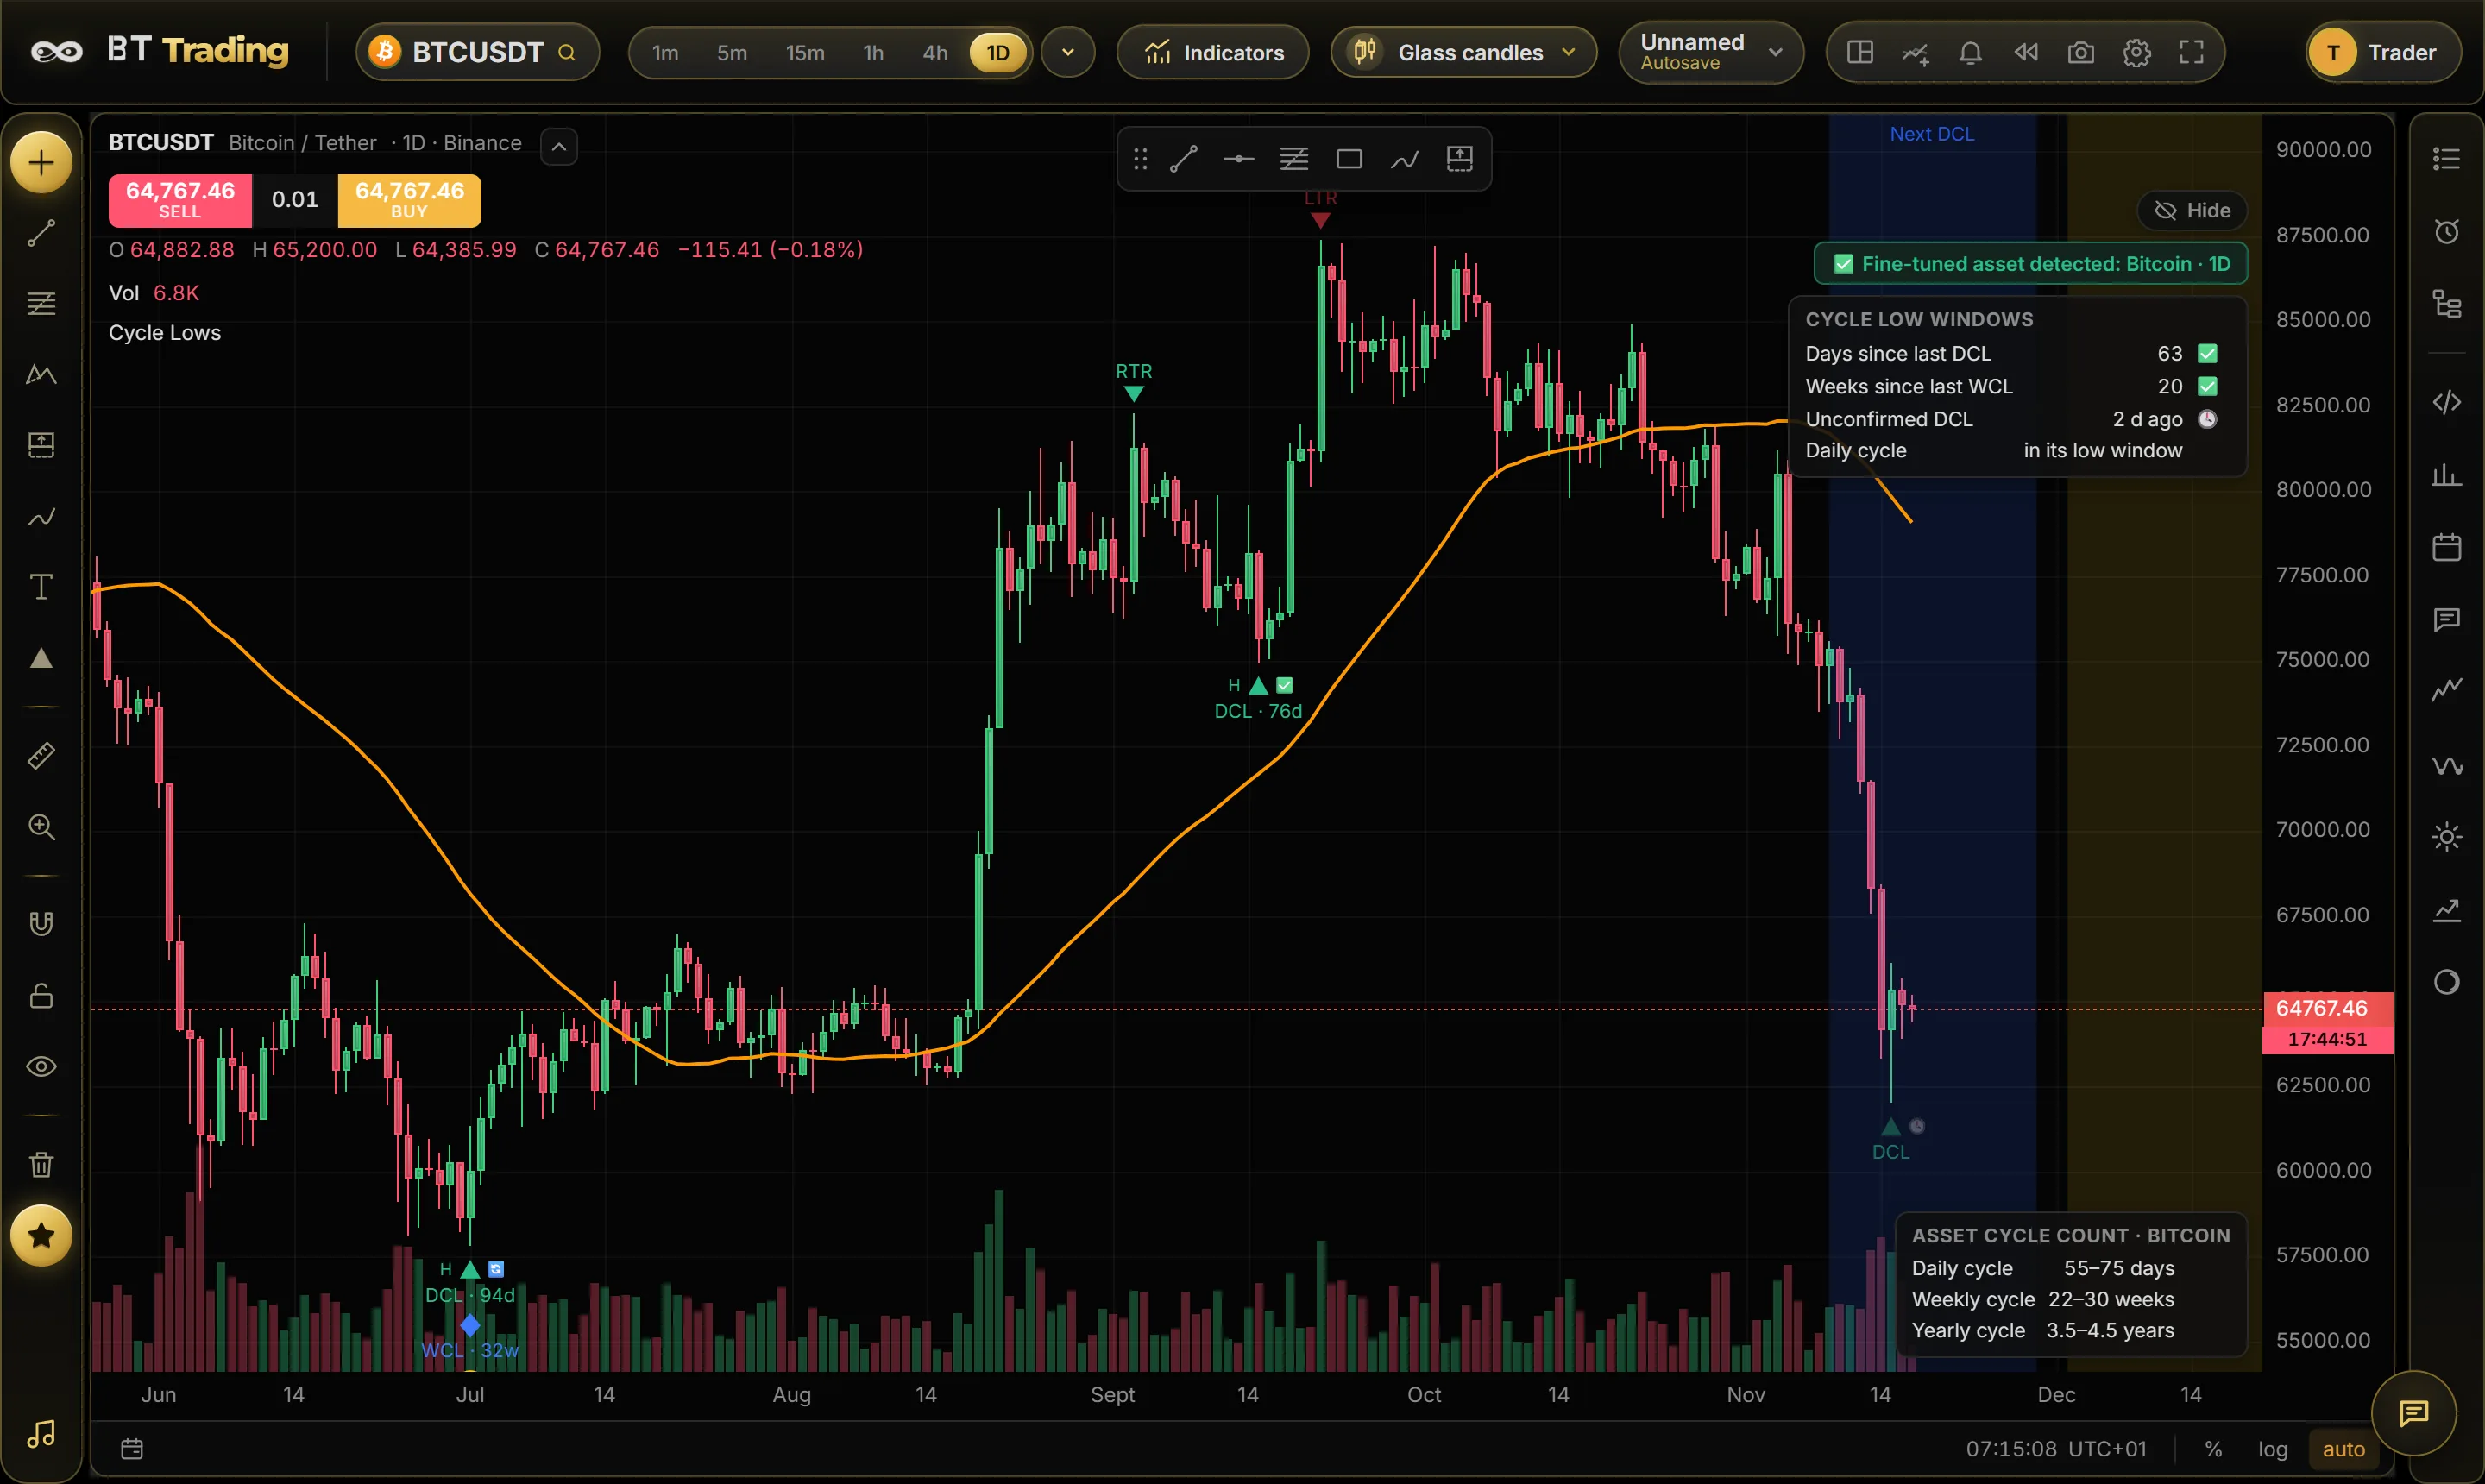 How to use Cycle LowsA step-by-step guide to cycle trading with the Cycle Lows indicator: what daily, weekly and yearly cycle lows are, how they are confirmed, w…
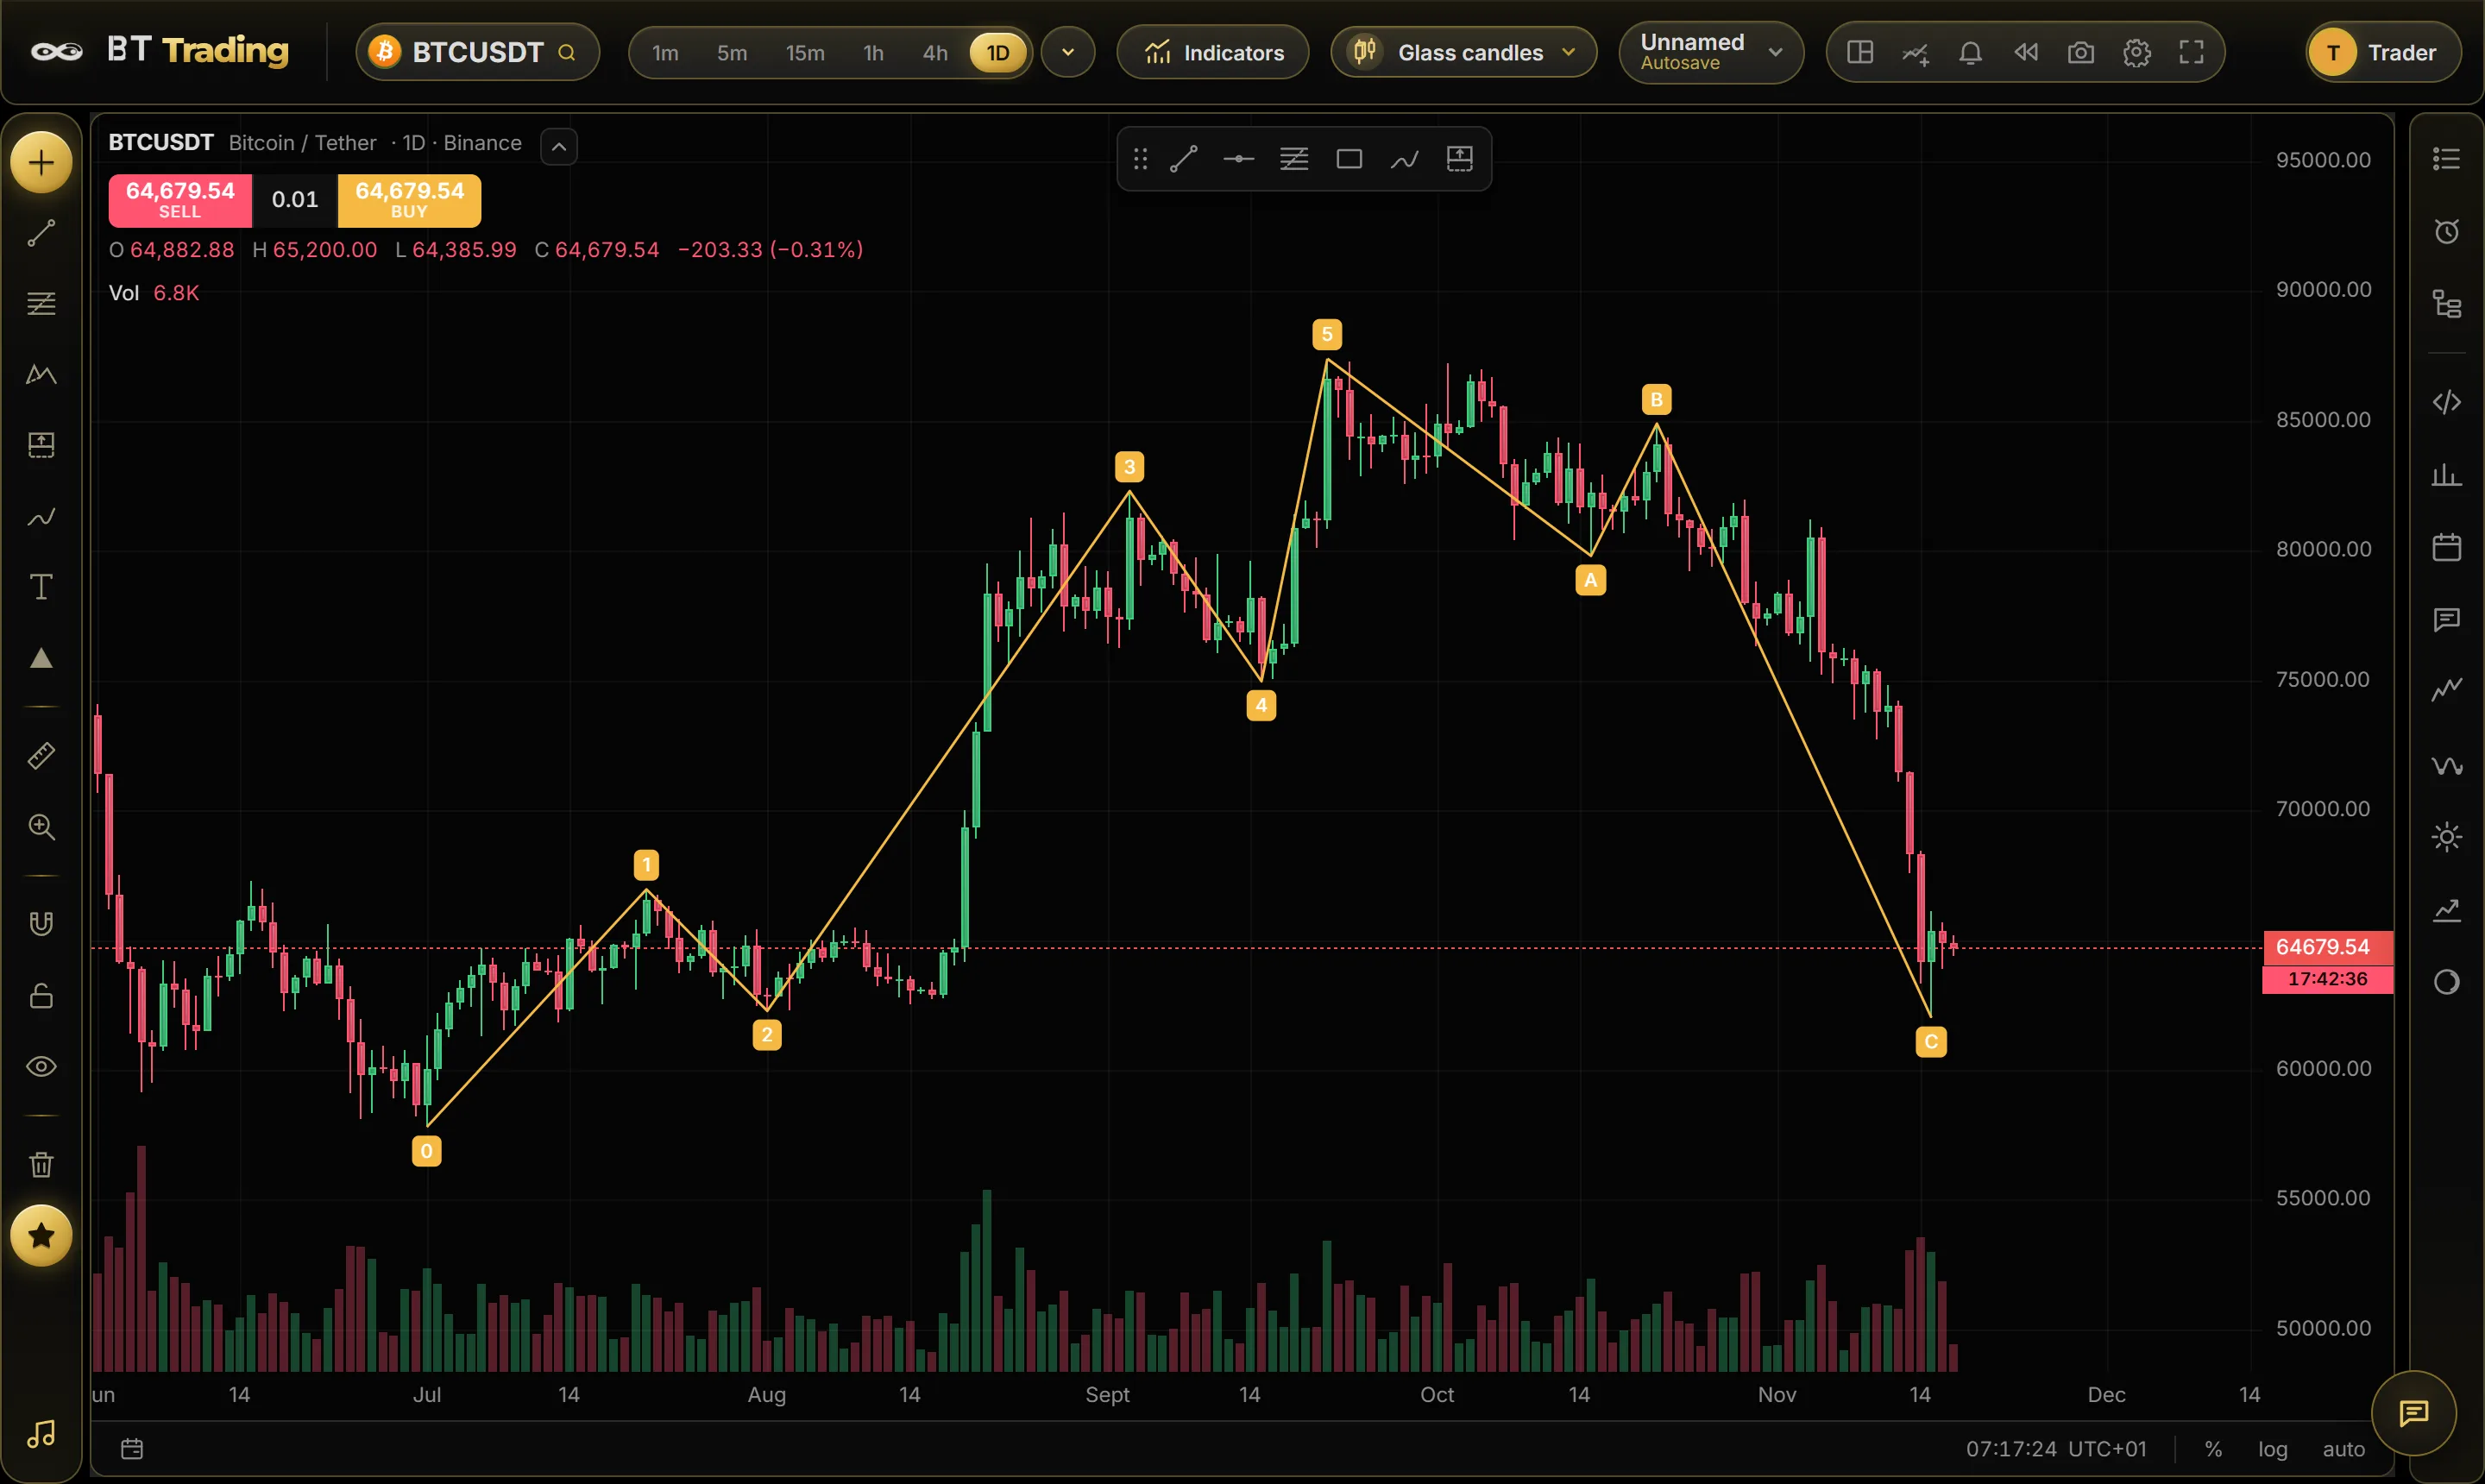 Elliott Wave rules explainedThe three hard Elliott Wave rules, the most useful guidelines (Fibonacci ratios, alternation), corrections (zigzag, flat, triangle) and how …